How to Use BVA Decision Search
BVA Decision Search lets you read and count real Board of Veterans' Appeals decisions. You can find cases on your condition, see grant and denial rates, and build simple charts. This guide walks through both views, every field, and the chart builder, in plain words. Everything here describes what the Board has already decided. It is research, not a prediction, and not legal advice.
What This Tool Does, and the Two Views
The tool searches the full text of hundreds of thousands of published Board decisions. You can use it to read example cases, to see outcome rates, or to build a chart that compares groups. It opens in the Simple view by default. A toggle at the top switches you to the Advanced view.
- Simple: plain-language questions grouped into four collapsible sections, Secondary conditions and Aggravation, Statistics by Condition, Deeper questions, and Decision Text and specific scenarios. Open a section, pick a question, type your condition, and the tool sets up the search for you. Best if you are new or want a fast answer.
- Advanced: the full form with every field and the chart builder. Best when you want exact control over the search.
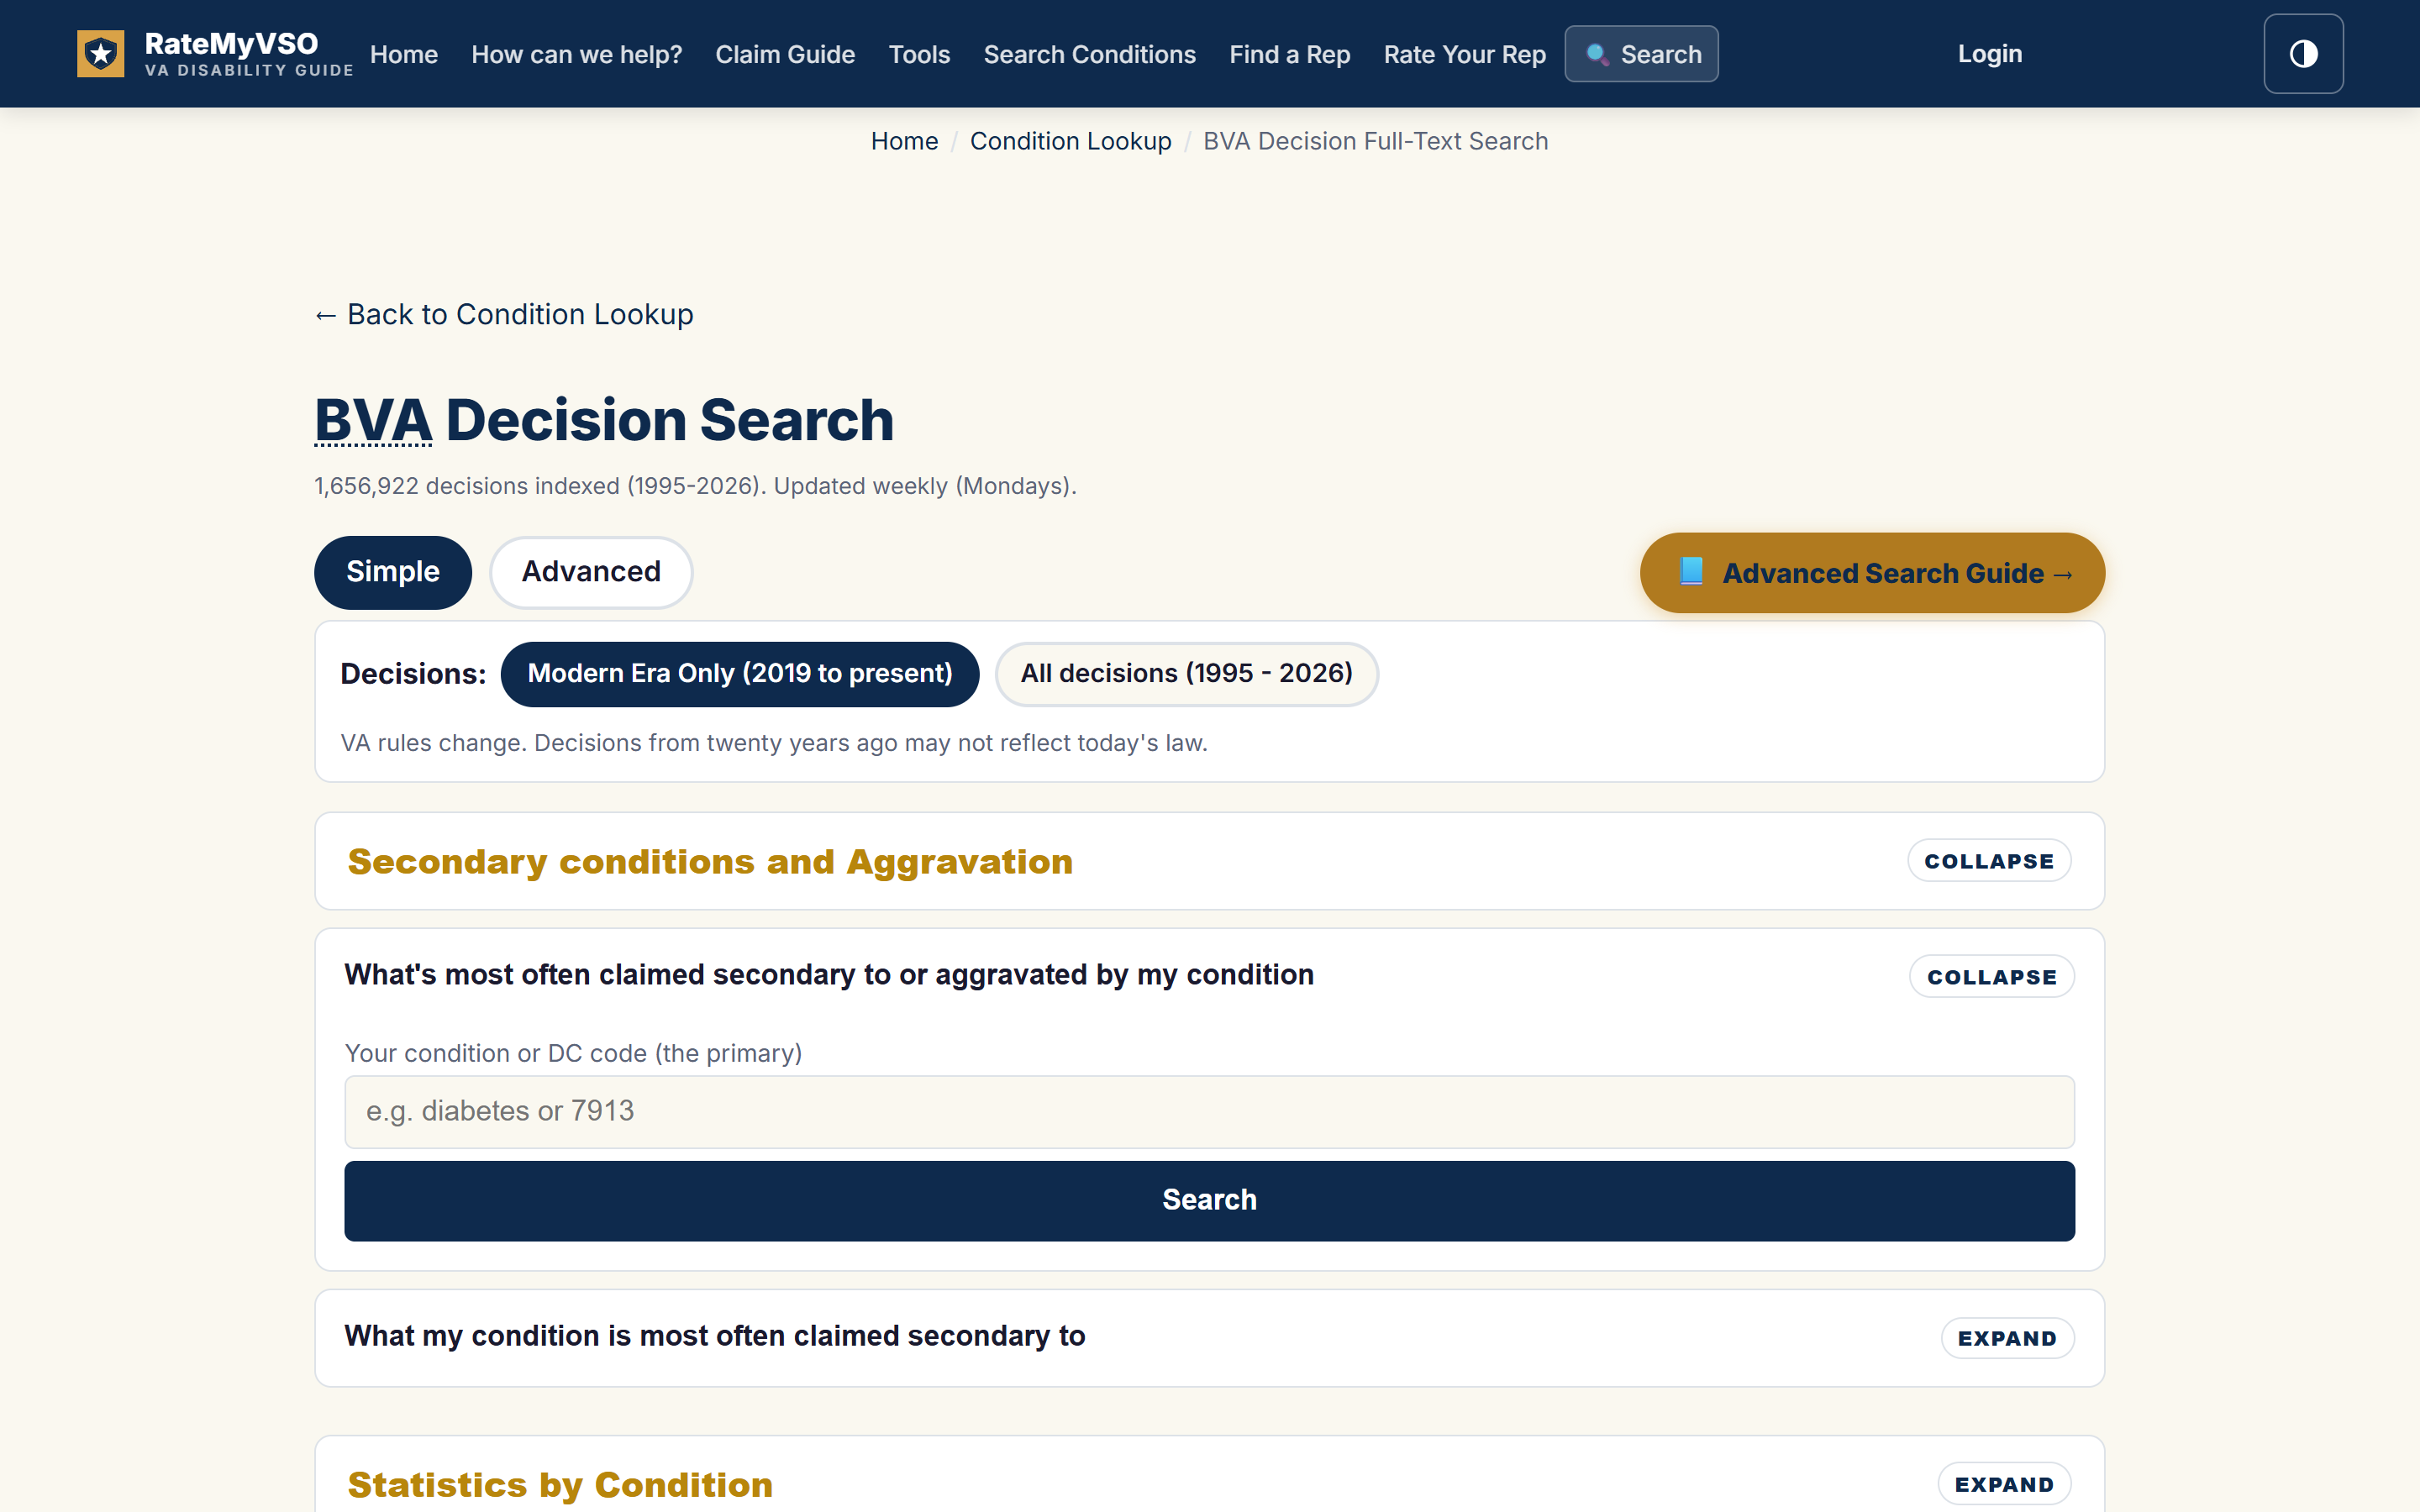
The Simple view. Open a section, pick a question, type your condition, and run it.
Both views search the same decisions and use the same data. Simple is a faster front door to the Advanced form. You can switch at any time. Your choice is remembered for next visit.
The Advanced Modes
In the Advanced view, a row of buttons near the top sets what the tool shows. Pick one, then run your search.
- BVA decisions: a list of real cases that match. Each result links to the full decision text. Use this to read how the Board handled a situation like yours.
- Overview: a bird's-eye view of the whole corpus, headline totals, the grant, denial, and remand mix, the conditions granted most often, and trends by year. It ignores your filters and describes the full index. The Overview section below covers it.
- Statistics: the outcome numbers for one condition. It shows the grant, denial, and remand split, plus how often things like a private nexus letter or a hearing appeared. Use this for a quick read on one condition.
- Explore (build a chart): a chart builder. You choose what to group by and what number to measure, and the tool returns a sorted table. Use this to compare years, theories, or conditions.
- Judge research: how the Board's judges have decided published cases. See the most-lenient and toughest judges on a condition, where one judge ranks, and how two judges compare. The Judge Research section at the end covers it in full.
Overview, Statistics, Explore, and Judge research count decisions. BVA decisions lists them. If you want to read cases, pick BVA decisions. If you want numbers, pick one of the others.
Every Search Field, Explained
These fields appear on the Advanced form, not the Simple view. You can use one or many. The more you fill in, the narrower your results. Most fields work in every mode. Statistics and Explore hide only Outcome, Representative, and Hearing format, which are not yet wired into the issue-level numbers; everything else, including Branch, Appeal type, and the More filters checkboxes, applies in Statistics and Explore too.
- Search box: free text. Type a word, a phrase, or a case name. Put a phrase in quotes to match it exactly, like
"effective date". This searches the full text of decisions and is the field to use for keywords and case law. - Condition: type a condition name like PTSD, or a diagnostic code like 9411, and pick from the list. This limits results to decisions that ruled on that condition.
- Secondary to: the primary condition. Use this to find cases claimed as secondary to, or aggravated by, the condition you type. Example: type diabetes to find conditions claimed secondary to diabetes.
- Outcome: grant, denial, remand, mixed, or unknown. Limits results to that result. BVA decisions mode only.
- Branch: the service branch, such as Army or Navy. Works in Statistics and Explore as well.
- How claimed: the legal theory, such as direct, secondary, aggravation, presumptive, increased rating, effective date, TDIU, or CUE. This is how the claim was framed.
- Nexus finding: how the Board read the medical link on that issue: positive, negative, equivocal, or not reached.
- Decided on element: which of the three service-connection elements decided the case, the diagnosis (current disability), the in-service event, or Linked to Service (the nexus). A service-connected claim needs all three; this tells you which one the decision turned on.
- SMC level: Special Monthly Compensation. "Filter Off" applies no SMC filter. "Any SMC Level" covers all years and works in Statistics. The specific levels, SMC-K through SMC-T, come from our analyzed SMC subset and are search-only; in Statistics and Explore the dropdown shows only Filter Off and Any SMC Level.
- Appeals system: AMA-era only (2019 and later), Legacy (before 2019), or all. The Appeals Modernization Act changed the rules in 2019, so this filter keeps the two systems apart.
- Sort by: relevance, newest first, or oldest first. Relevance puts the best match on top (see "How results are ranked" below for exactly what that means with and without quotes).
More filters
Open the More filters panel for extra controls, grouped into sets. These now apply in Statistics and Explore too, not just the BVA decisions list.
- Representative: the VSO or attorney, such as Disabled American Veterans. Reliable for decisions before 2019. AMA-era decisions do not list the rep in the published document, so this is search-only.
- Appeal type: the docket lane, such as Direct Review, Evidence Submission, Hearing, Higher-Level Review, or Supplemental Claim.
- Hearing format: videoconference, virtual, Travel Board, Central Office, or DRO. Search-only.
- DIC Appeal: survivor or DIC (Dependency and Indemnity Compensation) claims. For TDIU, use How claimed set to TDIU, which matches what the Board actually ruled on.
- Evidence present in the decision: checkboxes for a private medical opinion (which also covers a nexus letter or an IMO), and a buddy or lay statement. Finds decisions whose text cited that evidence. Presence does not mean the evidence caused the outcome.
- Service event or signal: MST, TBI, POW, and combat-related (1154(b)).
- Appeal status: returned from CAVC, substituted appellant, and withdrawn or dismissed.
- Conflict era: Vietnam, Korea, WWII, Gulf War (1991), and GWOT / Post-9/11 (the named Global War on Terror operations plus post-9/11 service).
- Presumption or exposure: Agent Orange, herbicide, Camp Lejeune, burn pits, PACT Act, radiation, asbestos, and Gulf War illness / MUCMI. These cover all years, use them rather than a date-limited toxic-exposure list.
How Results Are Ranked: Quotes vs No Quotes
The search behaves differently depending on whether you quote your words. Using knee pain as the example:
knee pain(no quotes): finds every decision containing both words anywhere in the text, even pages apart. That is a huge pile. The tool scores the pile by how often your words appear, takes the best 200, and then sorts those by meaning, asking "which of these is really about a painful knee?", and shows page one from that. This meaning step helps when you describe something in your own words: a search like "ringing in ears" can rank tinnitus rulings on top even though the decision used the medical term."knee pain"(with quotes): finds only decisions where those words appear side by side as an exact phrase. A much smaller, precise pile, ranked purely by how strongly the text matches. No meaning step, quotes tell the tool "I know exactly what I want," and nothing second-guesses you.
Two things never change either way: the set of matching decisions is decided by your words alone (the meaning step only re-orders, it never adds or removes results), and searches using quotes, citation numbers, or legal terms of art always keep exact, predictable ranking. Researchers who want fully deterministic ordering: quote your phrases, or sort by date.
One more case: typing a condition name. If your search text matches a known condition ("colon cancer", "PTSD"), the tool switches to that condition's diagnostic code and lists the decisions that actually ruled on it, so the list agrees with the Statistics view. Some codes cover several conditions (the digestive-cancer code covers colon, esophageal, and stomach cancer together), so the recent decisions are ordered by how closely each matches the words you typed, colon-cancer rulings first when you typed colon cancer. Choosing "newest first" instead gives plain date order.
Where a hit lands now matters
Every Board decision has the same anatomy: a short list of rulings ("Service connection for sleep apnea is granted"), a FINDINGS OF FACT section listing what the Board established, and many pages of legal discussion. The search knows the difference: a hit inside a ruling sentence counts roughly ten times a hit in the discussion, and a hit in the findings about four times. So a decision that actually decided a sleep apnea claim outranks one that merely mentions sleep apnea in passing. Each result card also shows the decision's ruling line, so you can see the outcome without opening it.
The "Search in" dropdown above the mode picker takes this further. "Entire decision text" is the normal search. "Rulings only" restricts your words to the ruling sentences themselves: every result actually decided the thing you typed. "Findings only" restricts them to the FINDINGS OF FACT section, useful for researching what facts the Board established ("private nexus opinion", "continuity of symptomatology"). Both narrow scopes search a small, precise slice of each decision, so expect far fewer results than the whole-decision search, that is the feature, not a malfunction. Narrow scopes always use exact, predictable ranking (the meaning step never applies to them).
Explore, the Chart Builder
Explore turns the corpus into a sorted table. You set a few dropdowns and the tool counts the decisions for you. Here are the controls.
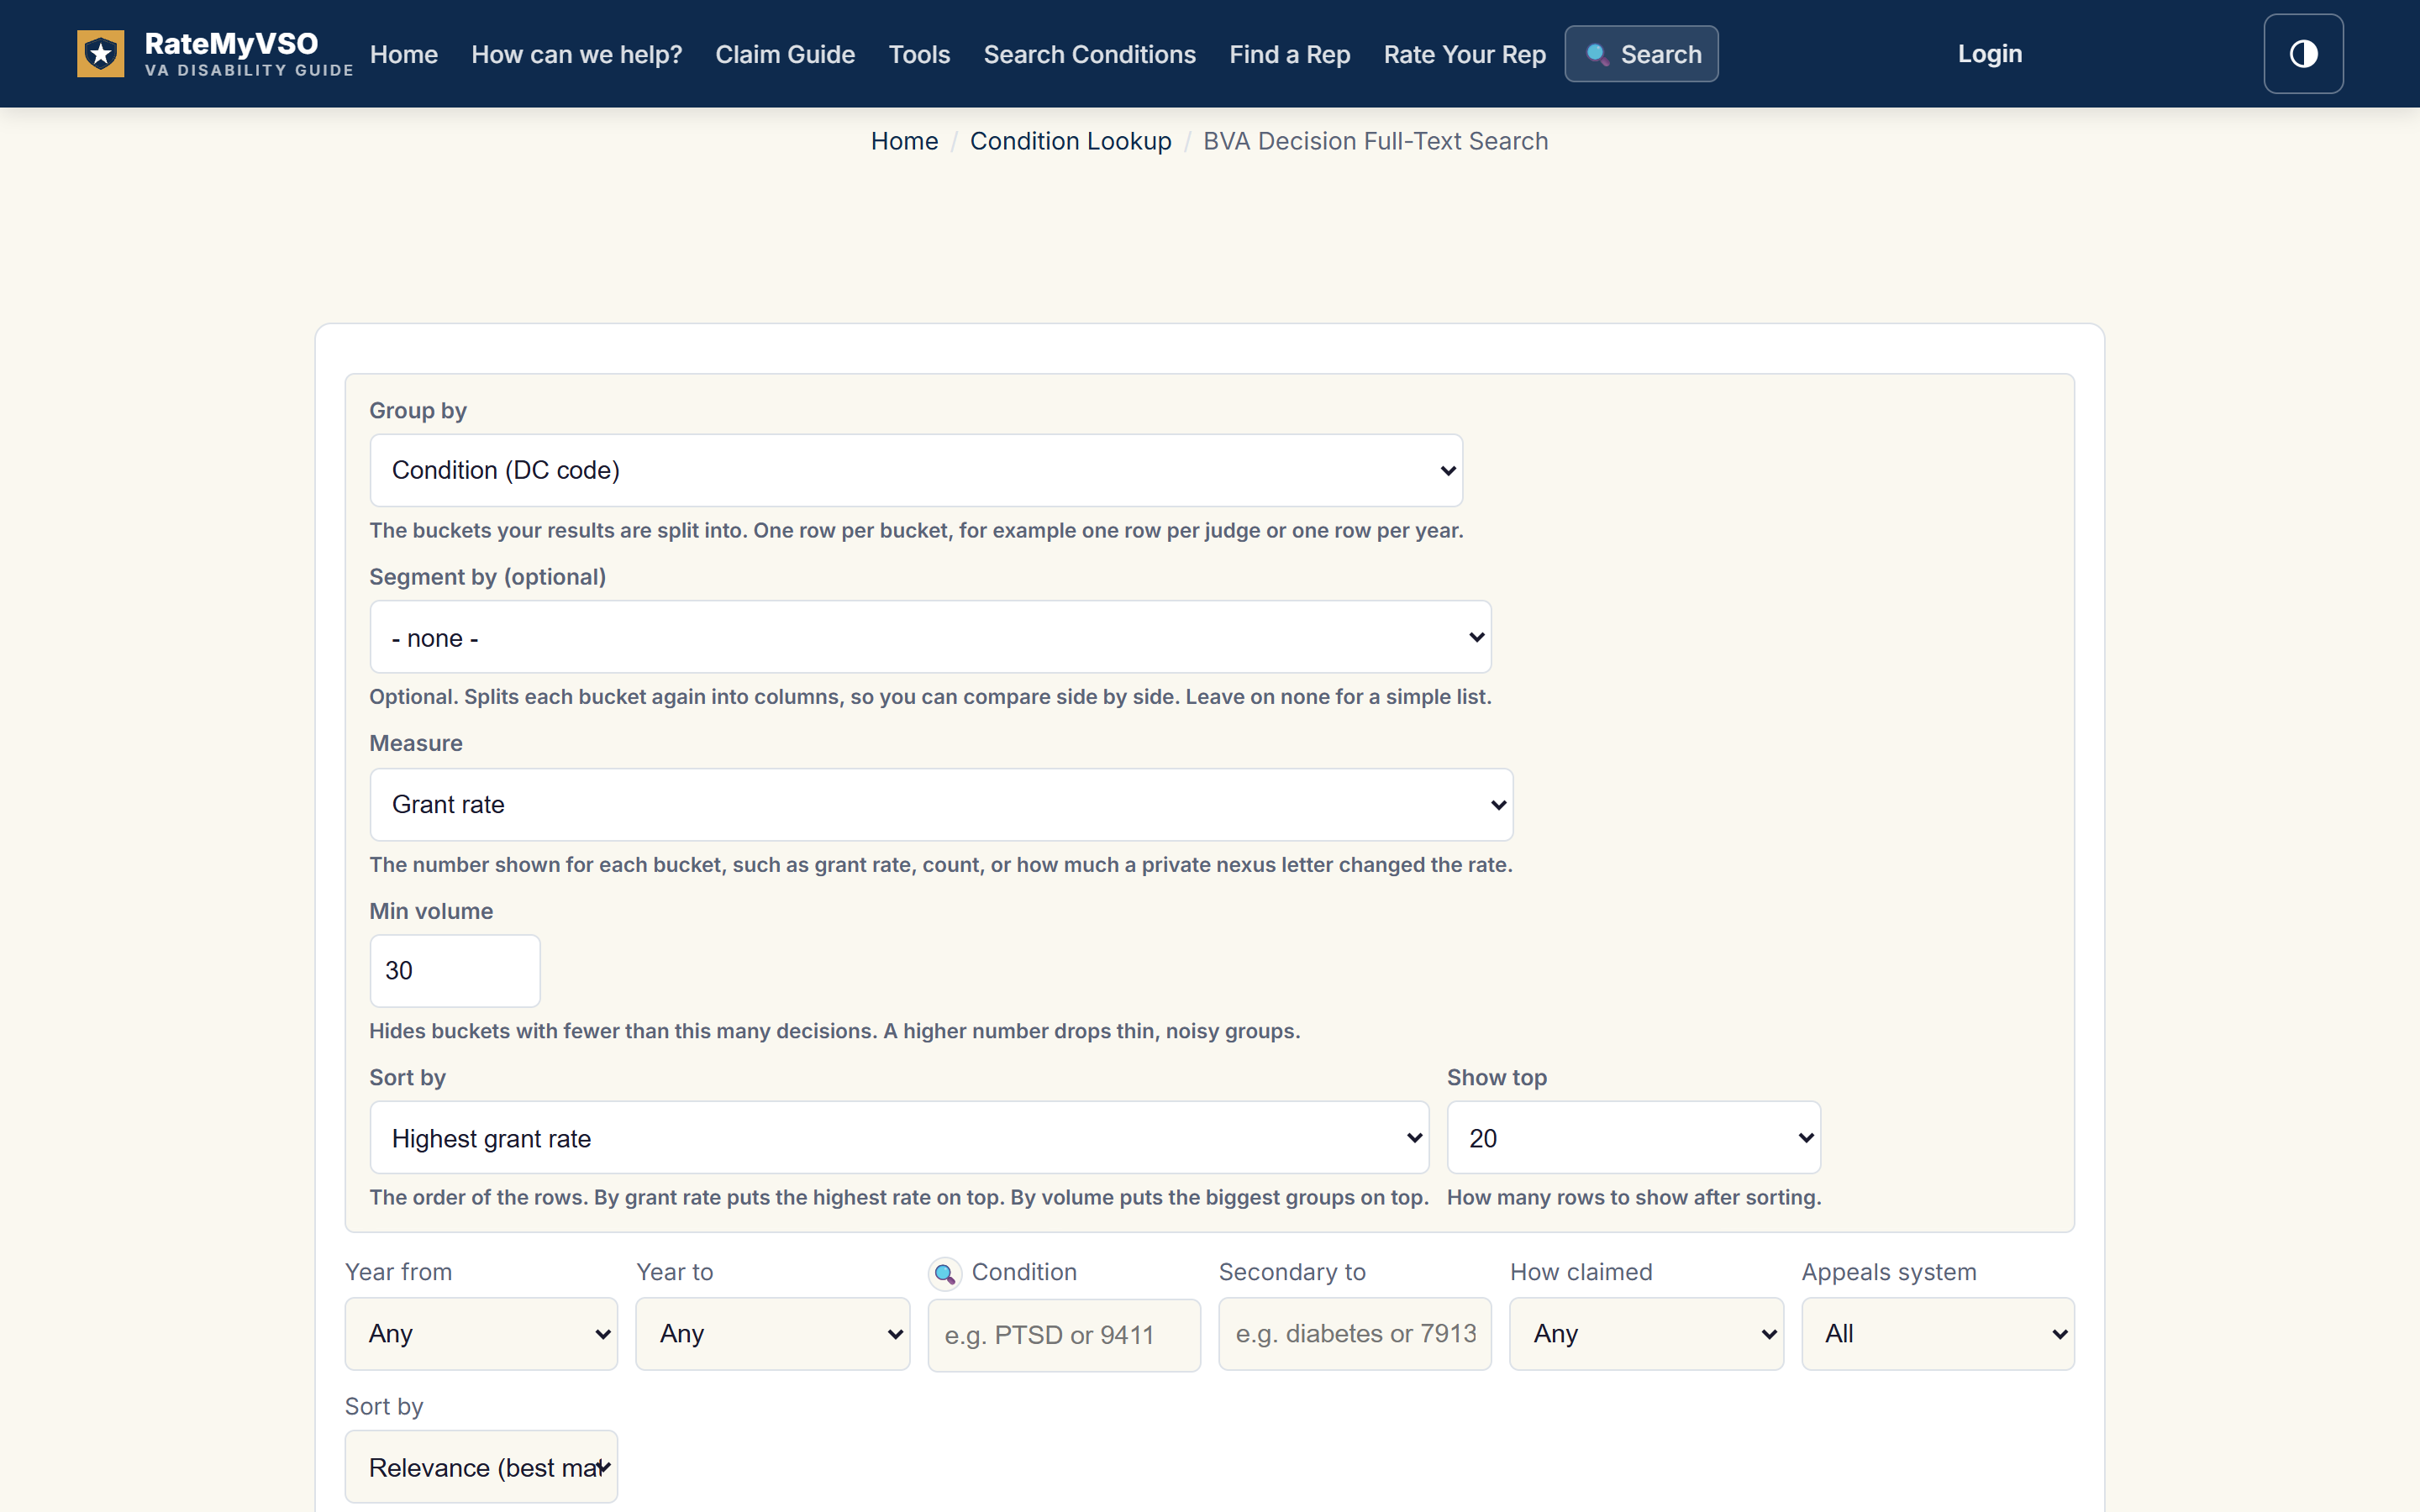
The Explore controls. Each dropdown has a short note under it.
- Group by: the buckets your results are split into. You get one row per bucket. Pick one of these:
- Condition (DC code): one row per diagnostic code that was claimed.
- Primary condition (secondary to / aggravated by): one row per primary condition that the claimed condition was tied to as a secondary or an aggravation.
- Legal theory: one row per way the claim was framed, such as direct, secondary, aggravation, presumptive, increased rating, effective date, TDIU, or CUE.
- Medical opinion language: one row per strength of the nexus opinion, such as supportive, at least as likely as not, speculative, or none.
- Nexus opinion source: one row per source of the medical opinion, such as a private doctor, a VA C&P exam, both, or none.
- Claim type: one row per type of claim, such as service connection or increased rating.
- Missing element (denials): among denied issues only, one row per element the Board found missing, such as no current diagnosis, no in-service event, or no nexus.
- Representation: one row per representative type, such as an attorney, a VSO like DAV or VFW, a state agency, or pro se.
- Judge: one row per Board judge.
- Service branch: one row per branch, such as Army, Navy, Air Force, Marine Corps, or Coast Guard.
- Year: one row per decision year.
- Hearing held: two rows, cases with a Board hearing and cases without one.
- Segment by: optional. It splits each bucket again into columns, so you can compare side by side. Leave it on none for a simple list. The choices are the same kind of dimensions as Group by, shown as columns:
- None: no columns. You get a simple one-column list.
- Legal theory: a column per way the claim was framed.
- Medical opinion language: a column per strength of the nexus opinion.
- Nexus opinion source: a column per source of the medical opinion.
- Claim type: a column per type of claim.
- Year: a column per decision year, good for trends over time.
- Service branch: a column per branch of service.
- Hearing held: two columns, with a hearing and without.
- Condition (DC code): a column per diagnostic code.
- Primary condition (secondary to / aggravated by): a column per primary condition the claim was tied to.
- Measure: the number shown for each bucket. There are six. See the list below.
- Min volume: hides buckets with fewer than this many decisions. A higher number drops thin, noisy groups. Raise it when small samples clutter the chart.
- Sort by: the order of the rows. By grant rate puts the highest rate on top. By volume puts the biggest groups on top.
- Show top: how many rows to show after sorting.
The six measures
- Grant rate: the share of decided cases that were granted, out of granted plus denied.
- Volume: a plain count of how many decisions fell in the bucket.
- Remand rate: the share of cases that were sent back for more work.
- Private-nexus lift: how much the grant rate changed when the file had a private medical opinion, compared to when it did not.
- Representation lift: how much the grant rate changed when the veteran had a representative, compared to going it alone.
- Time to decision: the median number of months from the start of the appeal to the Board's decision.
Overview: A Bird's-Eye View of the Whole Corpus
The Overview mode is a single snapshot of the entire index, not a search. It ignores your filters and reports the whole corpus: headline totals, the overall grant, denial, and remand mix, the conditions granted most often, and how grant rates have moved by year. Use it to get your bearings before you narrow down.
- Open the Advanced view, then click the 📈 Overview button.
- Click Refresh overview. There is nothing to fill in. The snapshot covers every published decision in the index.
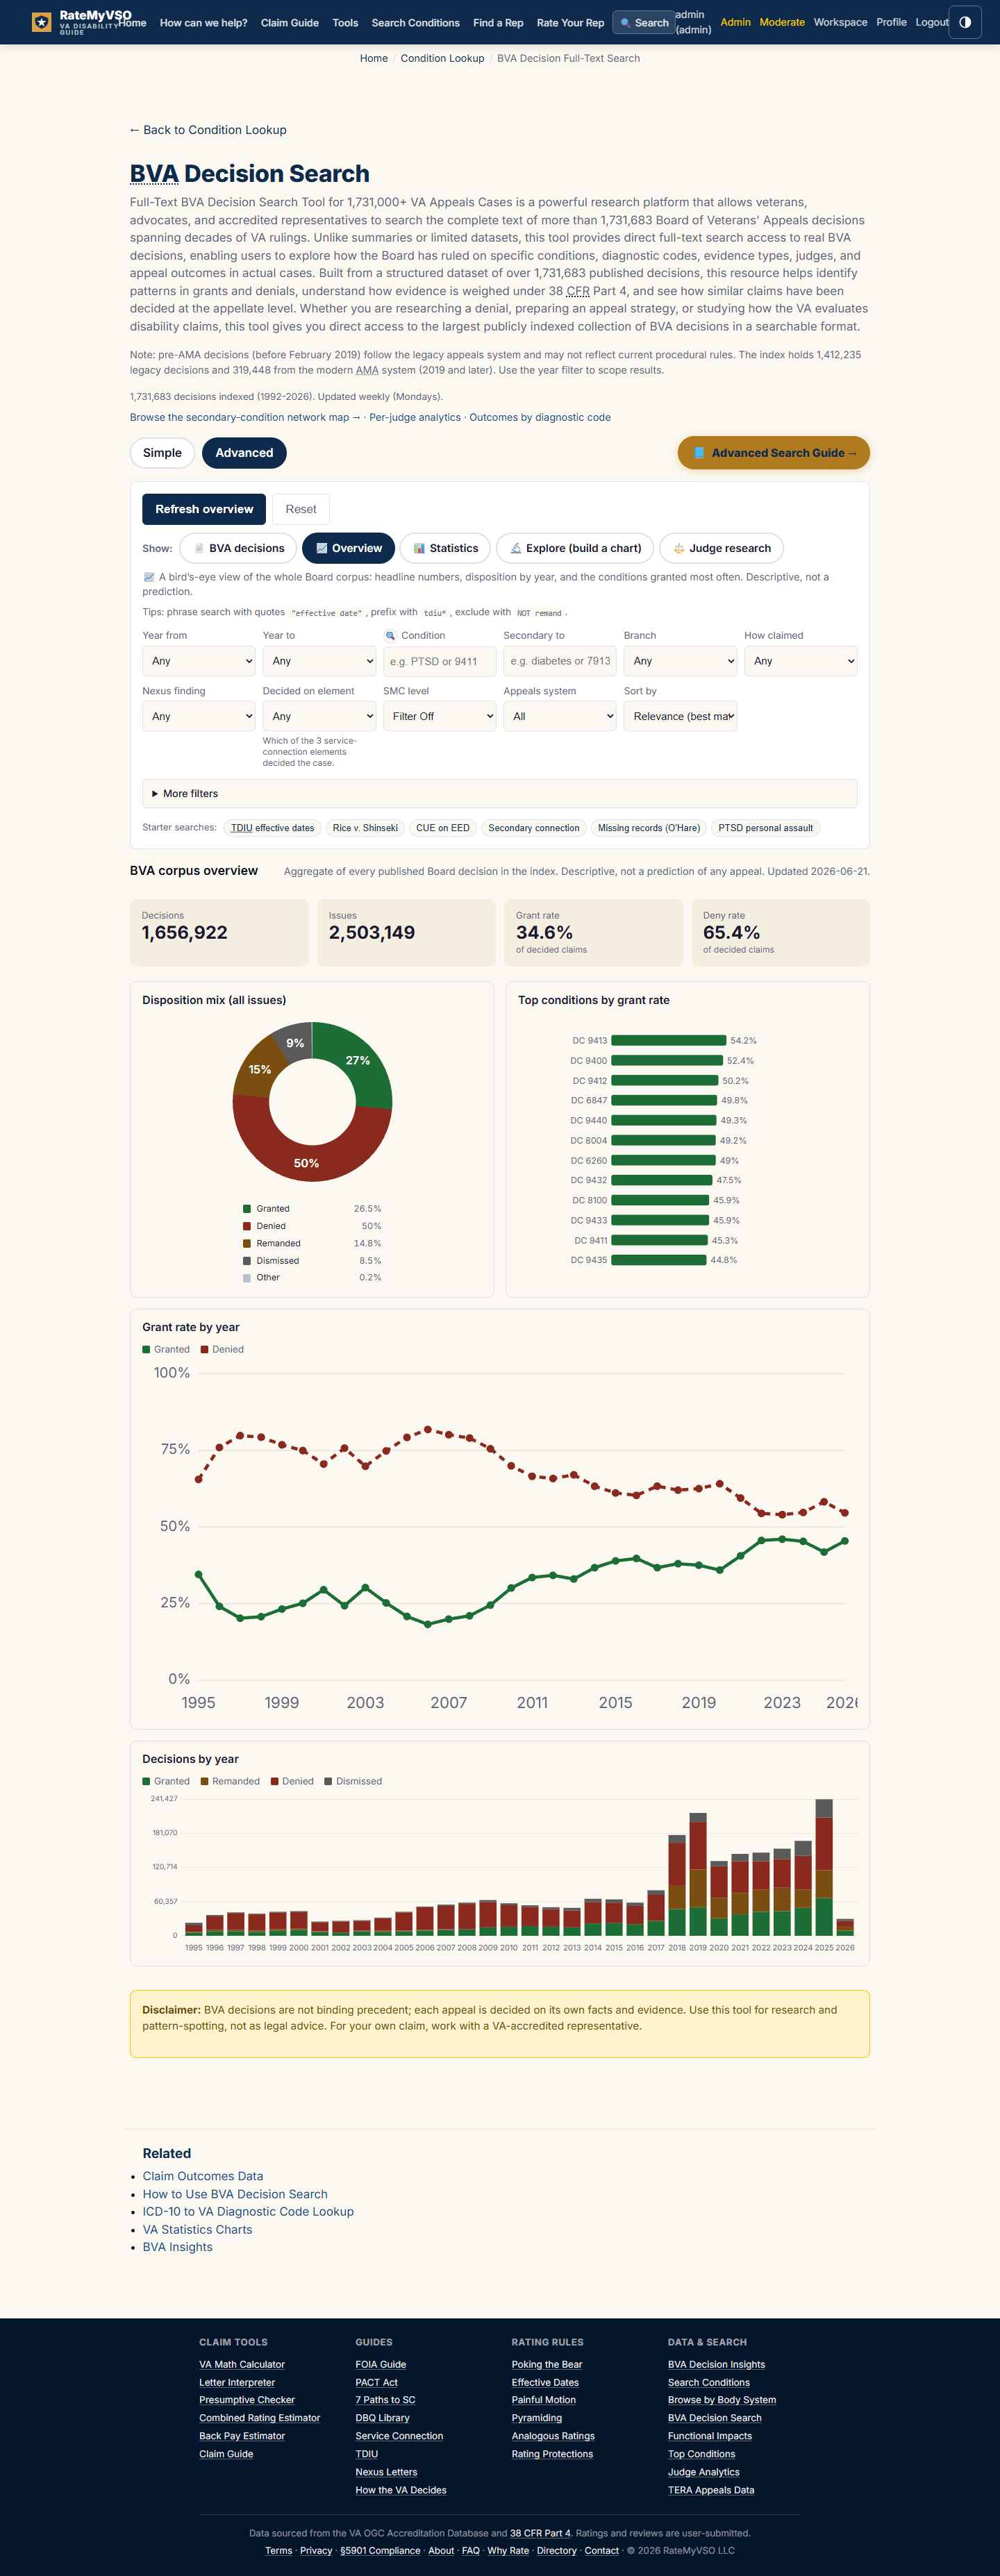
The Overview: corpus-wide totals, the disposition mix, the conditions granted most often, and trends by year.
What you get: the size of the index, the overall grant, denial, and remand split, the conditions with the highest grant rates, and the year-by-year trend. It is descriptive background on the whole archive, not a read on any one claim.
Recipes: Combining the Controls
Here are common questions and how to set them up, step by step. Each one ends with a picture of the filled-in form so you can copy it. Set the Appeals system to AMA-era for modern results.
The grant rate for one exact secondary claim
Statistics gives the grant, denial, and remand split for one specific claim. The example below is sleep apnea claimed secondary to PTSD.
- Open the Advanced view, then click the Statistics button.
- In the Condition box, type sleep apnea and pick it from the list.
- In the Secondary to box, type PTSD and pick it from the list.
- Set How claimed to Secondary to.
- For modern results, set Appeals system to AMA-era only.
- Click Show statistics.
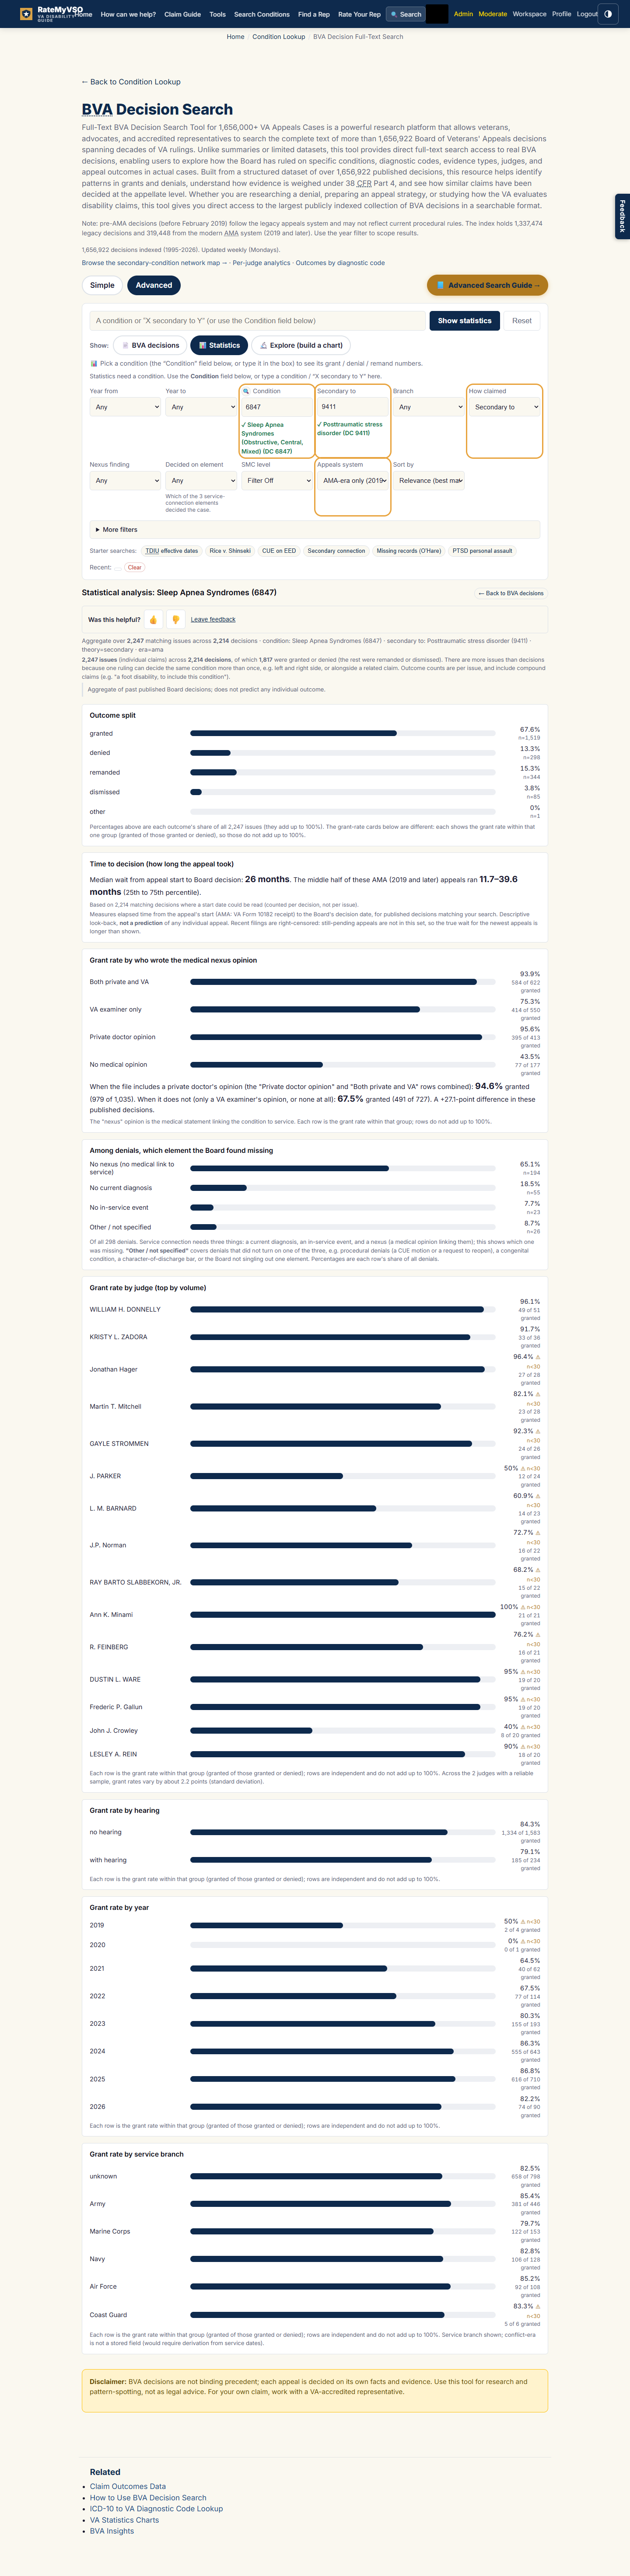
The Statistics view for sleep apnea claimed secondary to PTSD, with the fields you change highlighted.
What you get: the grant, denial, and remand split across published Board decisions on that exact claim. Read it as a pattern in past cases, not a promise about yours.
Does a private nexus opinion change the odds for that claim?
Explore can measure the private-nexus lift, how much the grant rate changed when the file held a private medical opinion, for one specific claim, year by year. The example below is sleep apnea claimed secondary to PTSD.
- Open the Advanced view, then click the Explore button.
- In the Condition box, type sleep apnea and pick it from the list.
- In the Secondary to box, type PTSD and pick it from the list.
- Set How claimed to Secondary to.
- Set Group by to Year.
- Set Measure to Private-nexus lift.
- For modern results, set Appeals system to AMA-era only.
- Click Build chart.
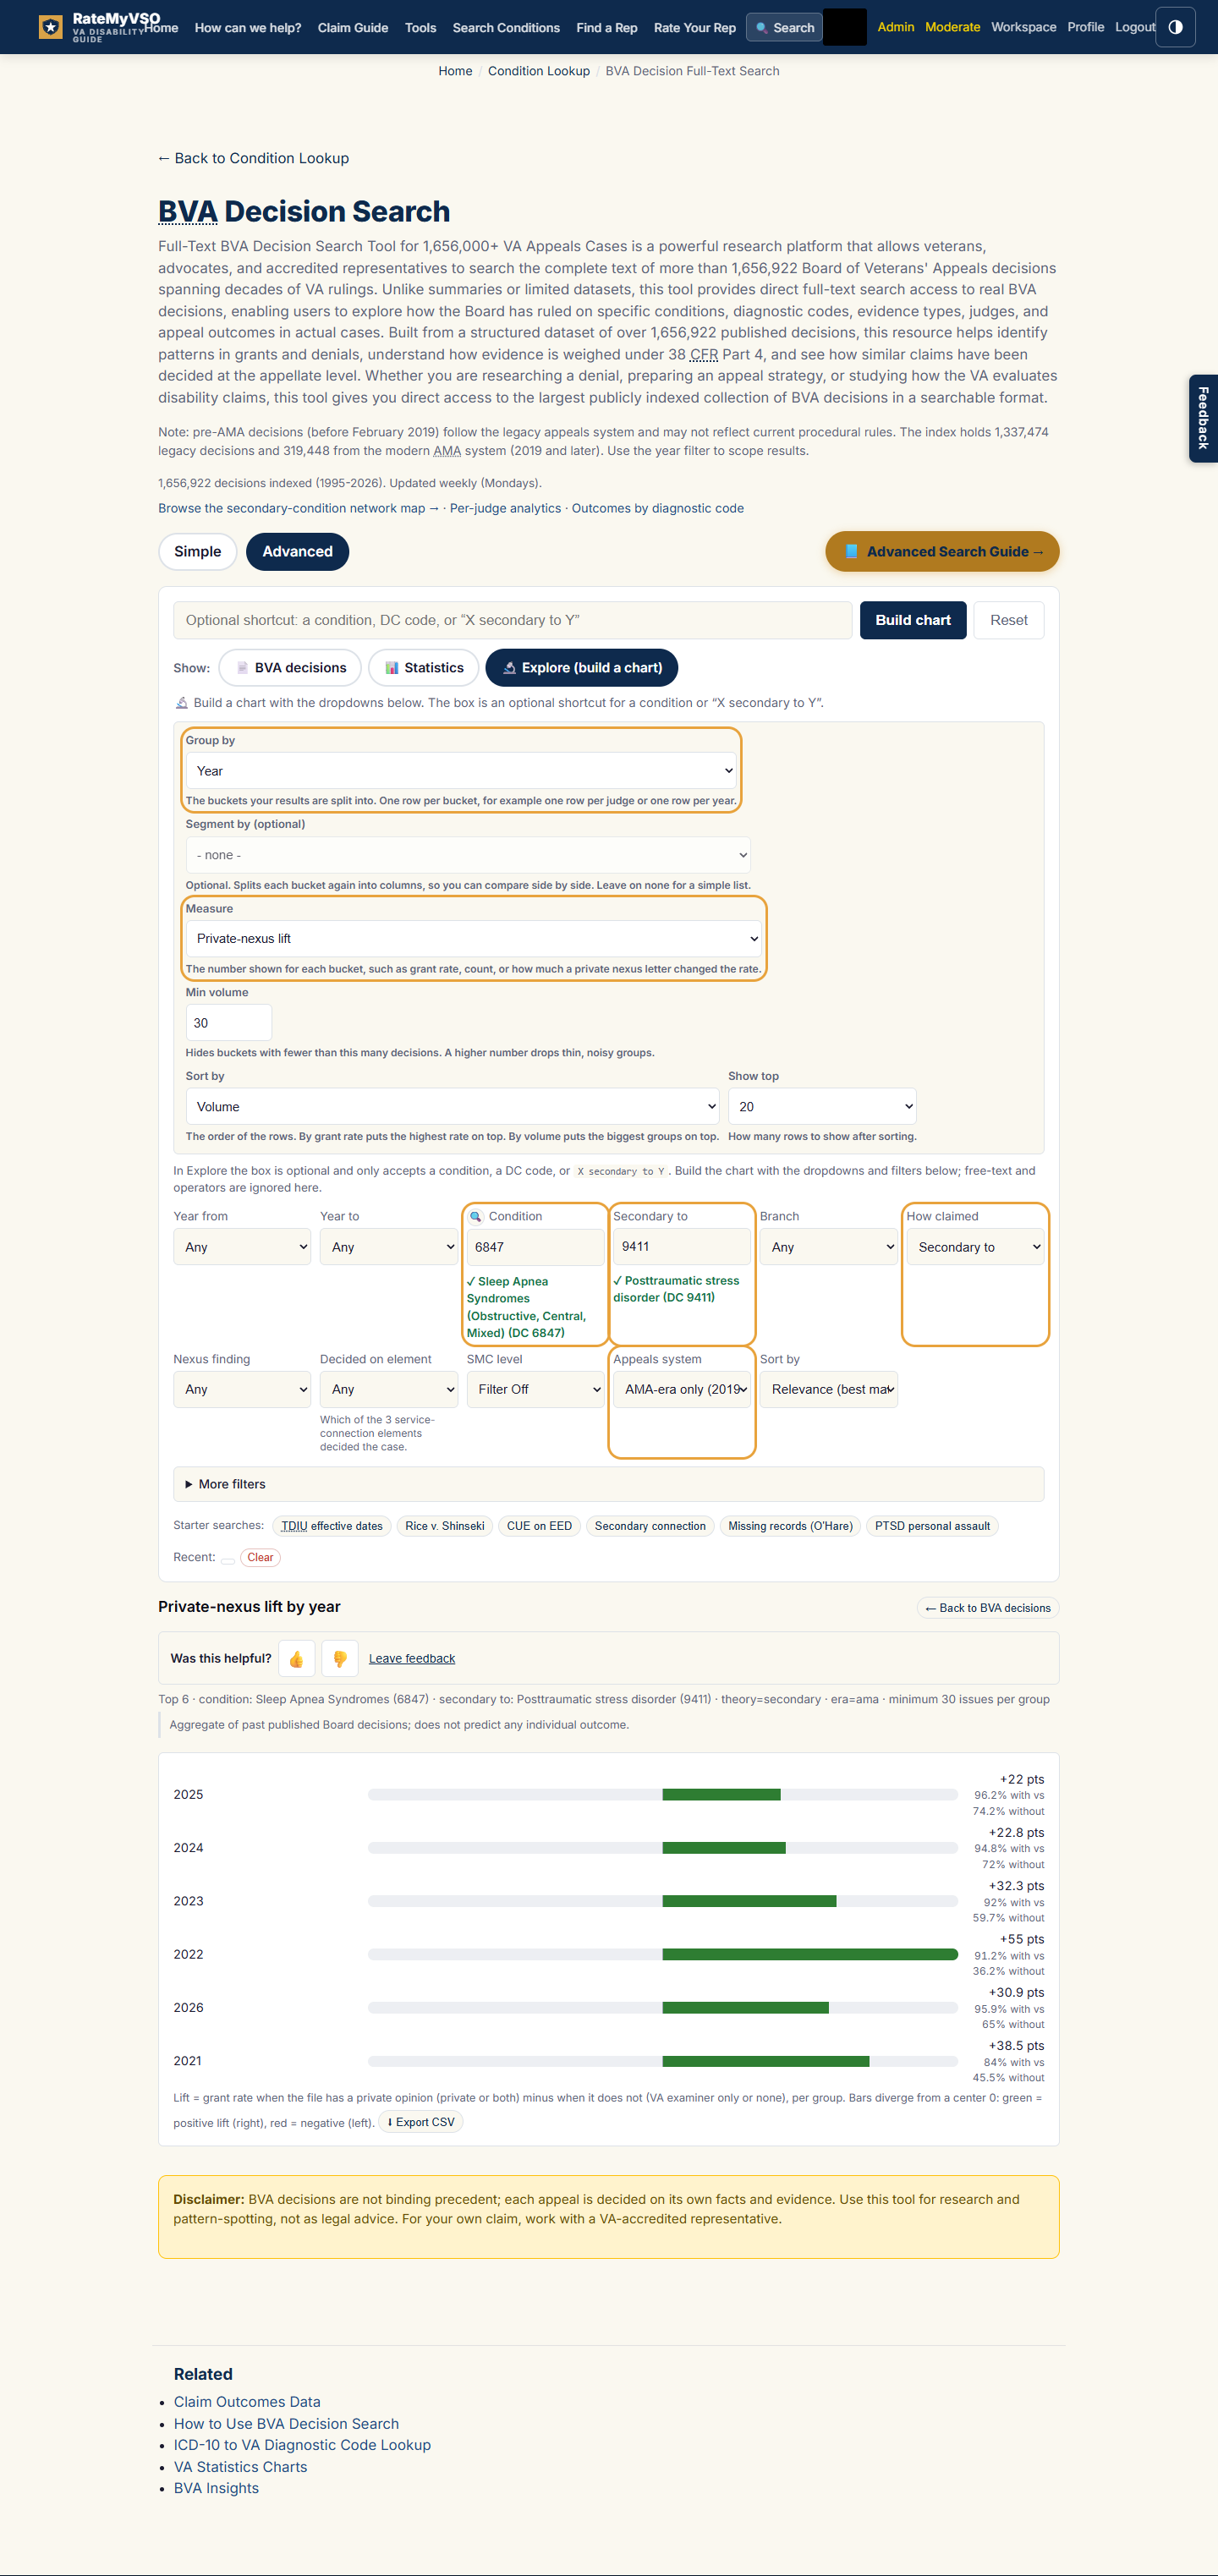
The Explore view measuring the private-nexus lift by year for sleep apnea claimed secondary to PTSD.
What you get: for each year, how much higher or lower the grant rate was when a private medical opinion was in the file. Small groups can swing a lot, so read the volumes alongside the lift.
What gets claimed as secondary to a condition I already have?
This is the one most veterans want. Start from a condition you are already service-connected for and see what others commonly claim off it, so you can spot issues you may be able to claim too. The example below uses diabetes.
- Open the Advanced view, then click the Explore button.
- In the Secondary to box, type the primary condition, like diabetes. Leave the Condition box empty.
- Set Group by to Condition (DC code).
- Set Measure to Volume and Sort by to Volume.
- For modern results, set Appeals system to AMA-era only.
- Click Build chart.
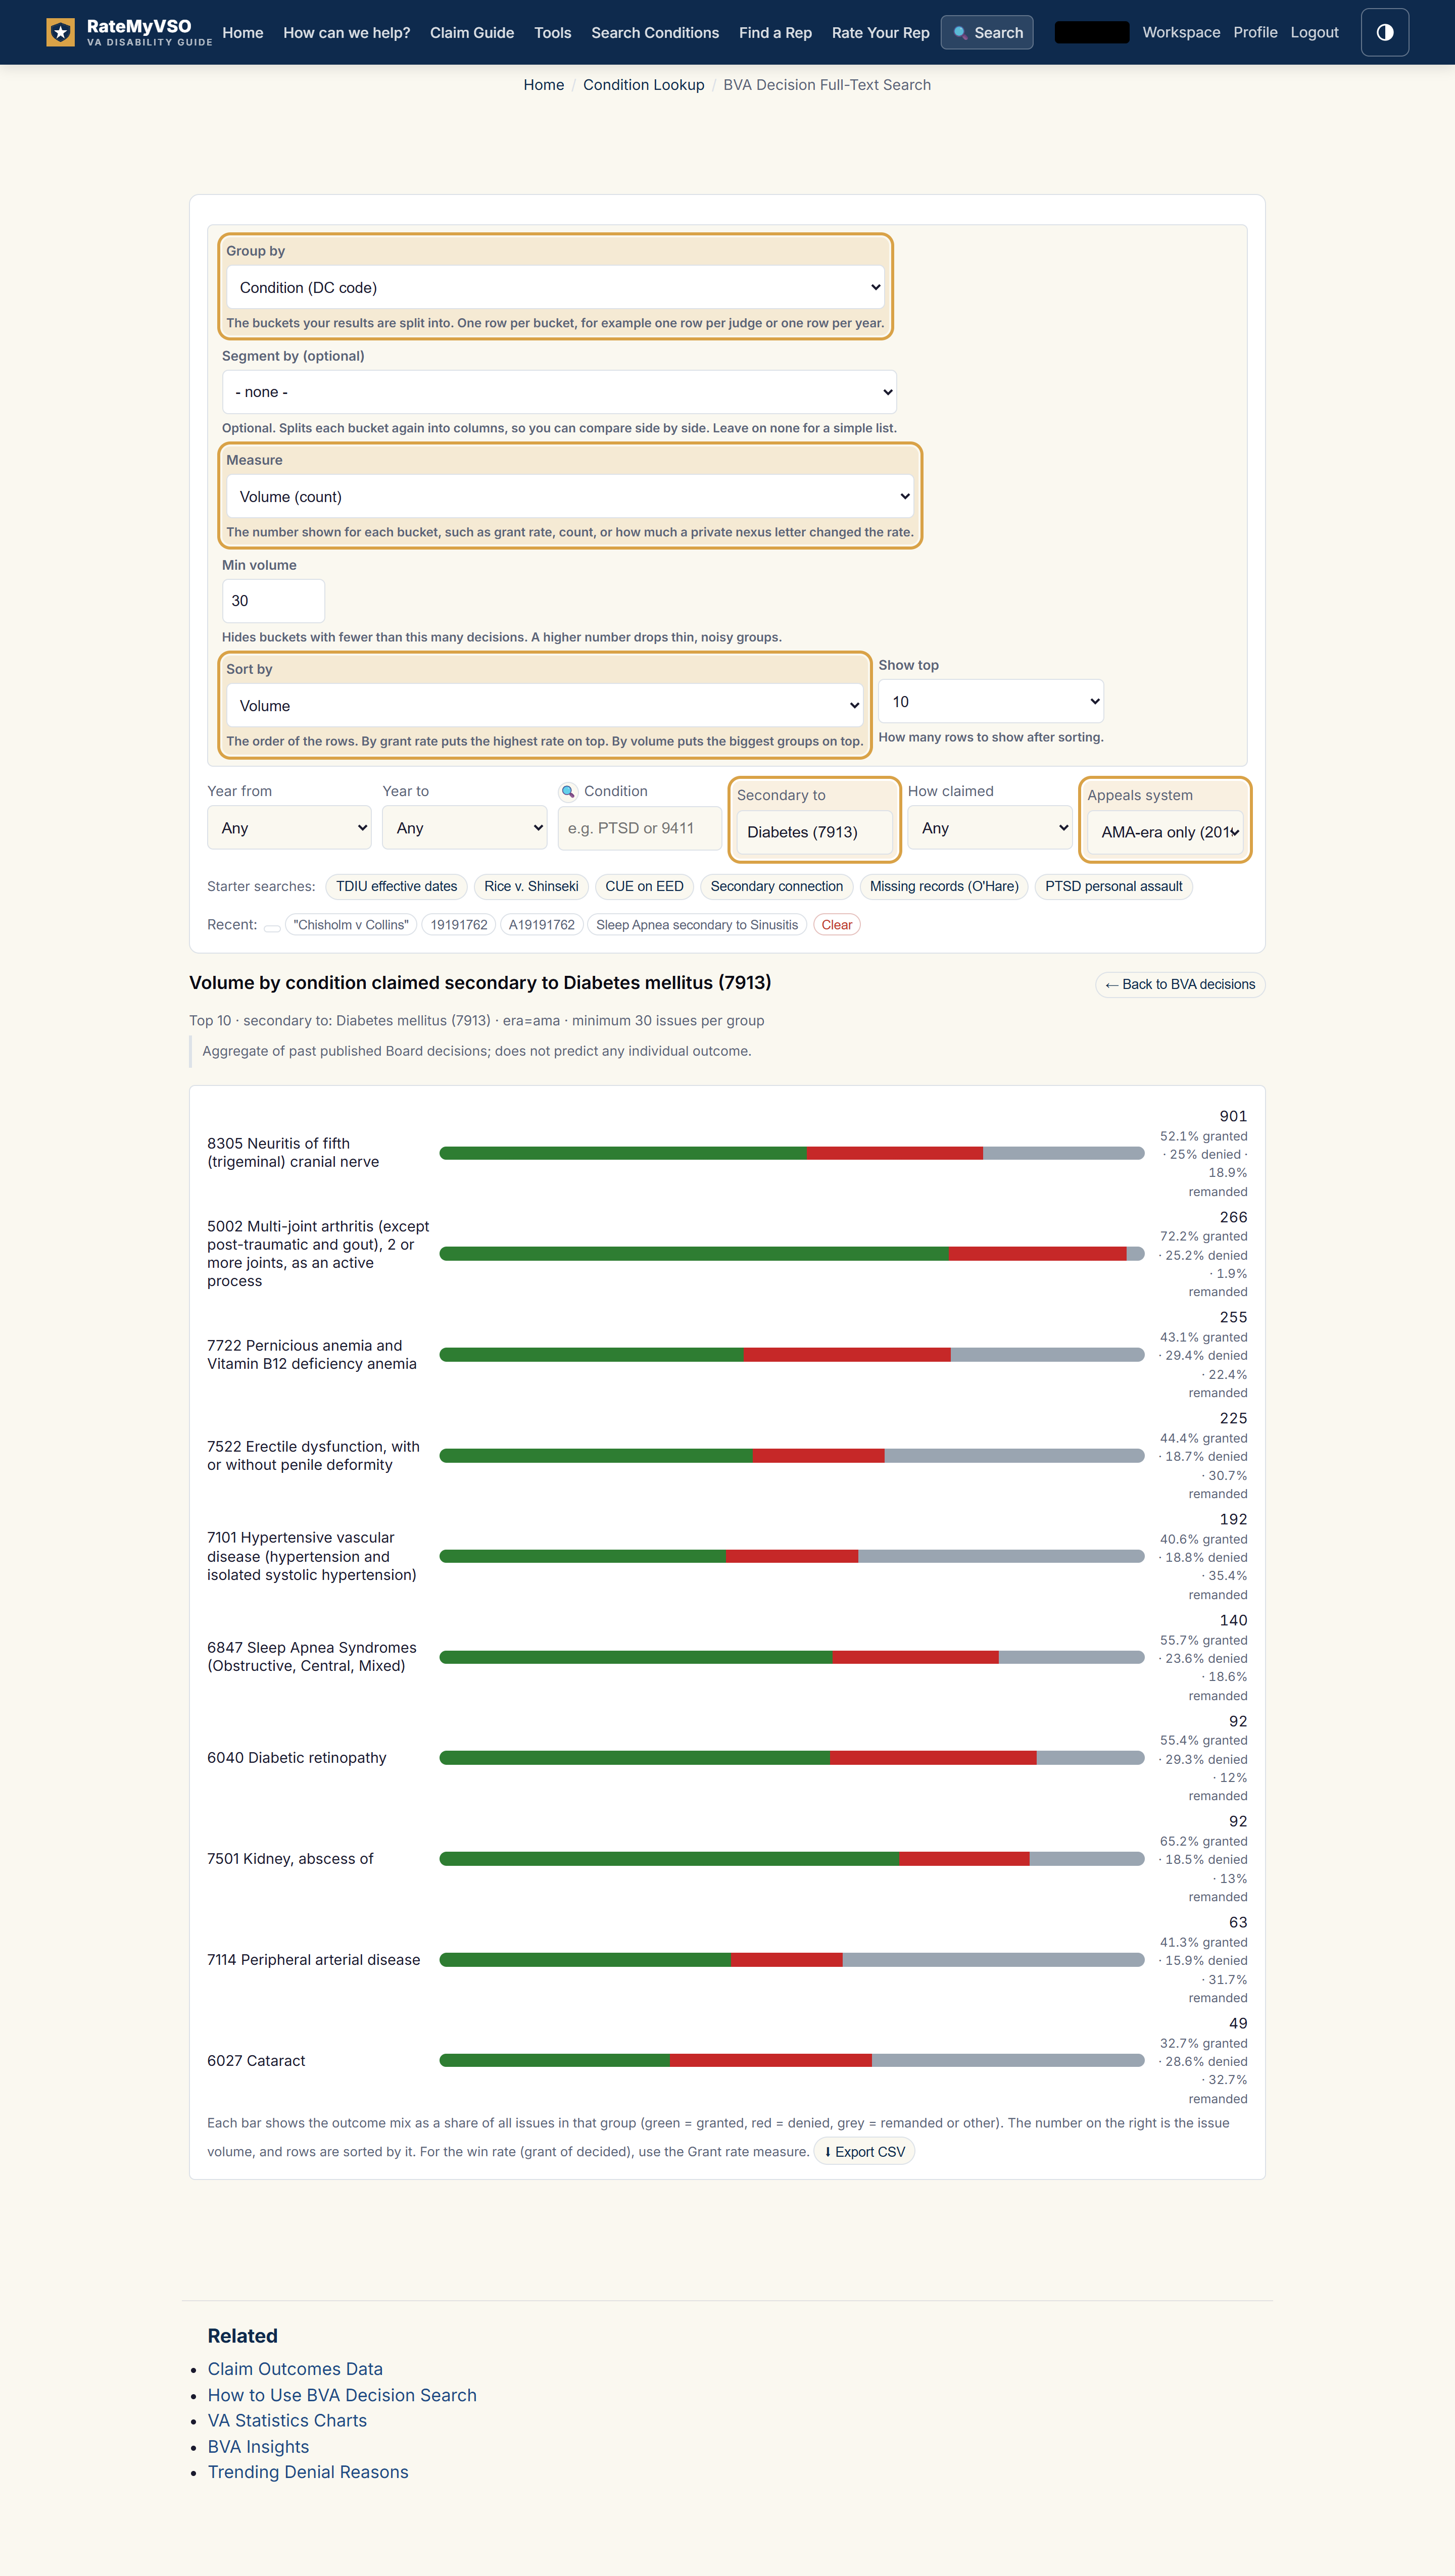
The Explore form set up for this question, with the fields you change highlighted, and the results below.
What you get: one row for each condition claimed secondary to that primary, with the most common at the top.
What is my condition most often claimed secondary to?
The reverse view. Start from your condition and see which primary conditions it is most often linked to. The example below uses sleep apnea.
- Open the Advanced view, then click the Explore button.
- In the Condition box, type your condition, like sleep apnea.
- Set How claimed to Secondary to.
- Set Group by to Primary condition (secondary to / aggravated by).
- Set Measure to Volume and Sort by to Volume.
- For modern results, set Appeals system to AMA-era only.
- Click Build chart.
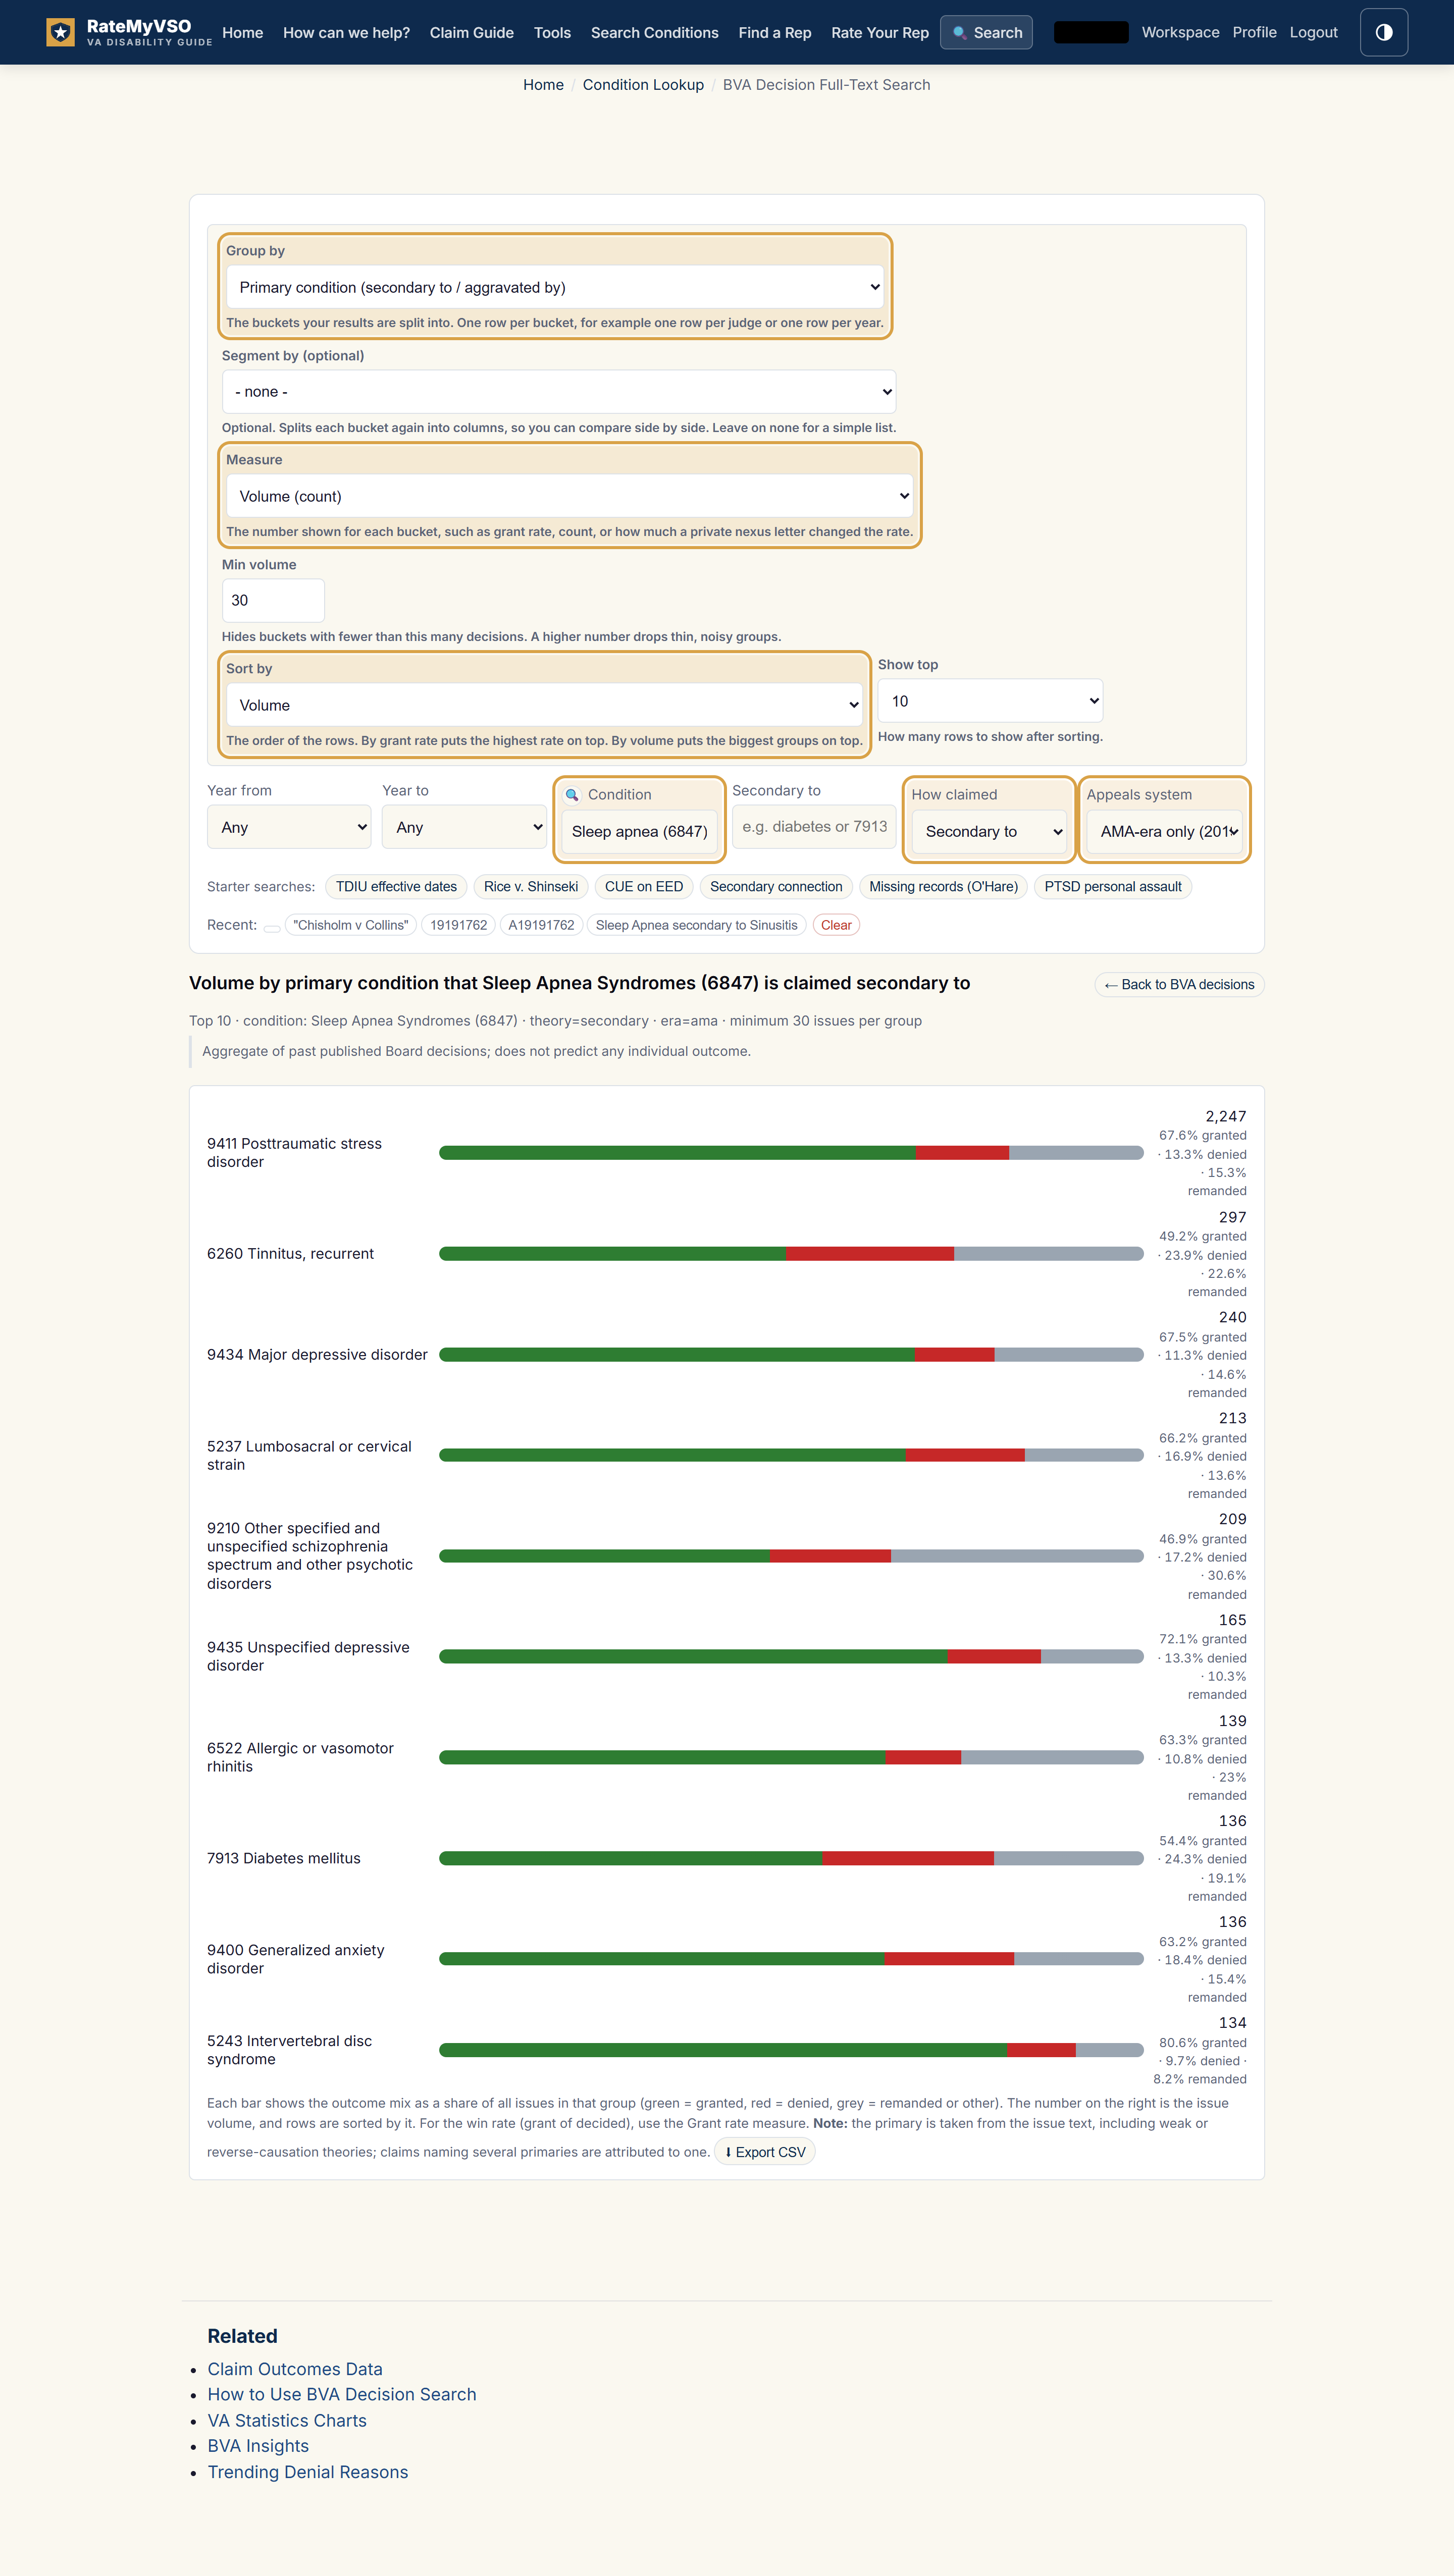
The Explore form set up for this question, with the fields you change highlighted, and the results below.
What you get: one row for each primary condition, with the most common at the top.
Does the strength of the medical opinion change the odds?
A nexus opinion is a doctor's statement linking your condition to service. This shows the grant rate for each strength of opinion. The example below uses PTSD.
- Open the Advanced view, then click the Explore button.
- In the Condition box, type your condition, like PTSD.
- Set Group by to Medical opinion language.
- Set Measure to Grant rate and Sort by to Grant rate.
- For modern results, set Appeals system to AMA-era only.
- Click Build chart.
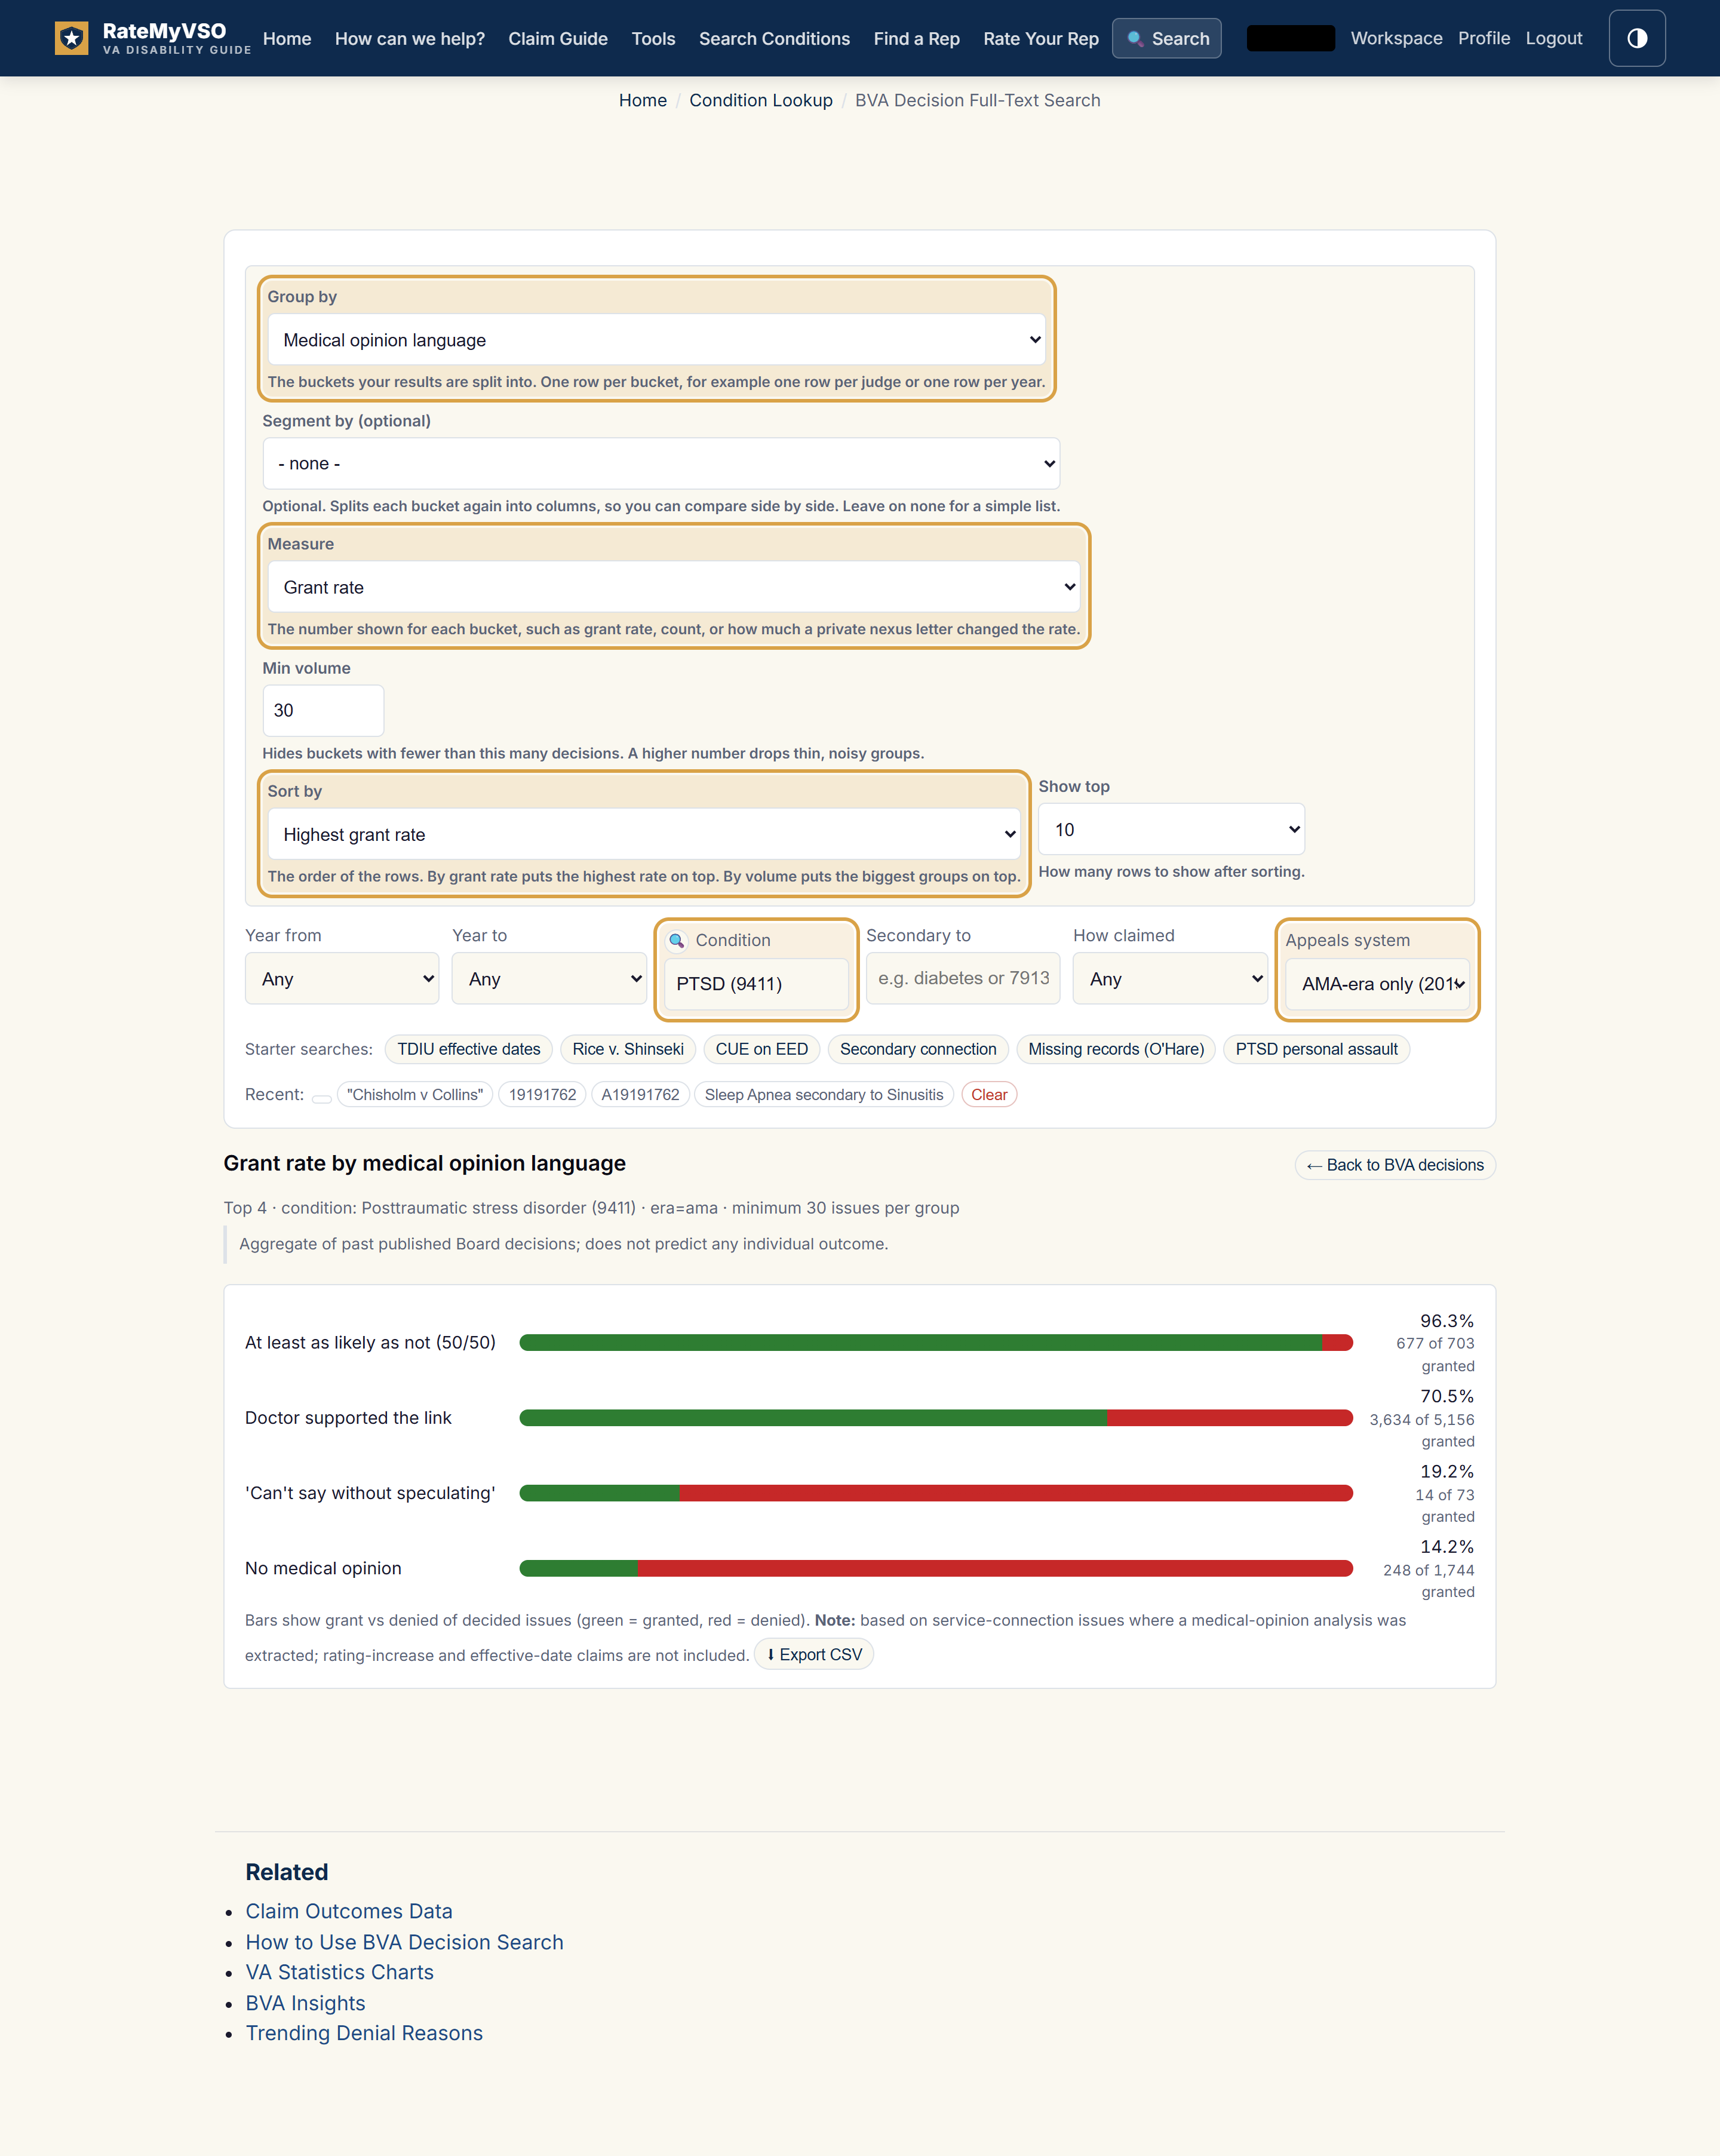
The Explore form set up for this question, with the fields you change highlighted, and the results below.
What you get: one row for each kind of opinion, such as "at least as likely as not" next to "no opinion," with the grant rate beside each. Read it as a pattern in past cases, not a promise about yours.
When this condition is denied, what was missing?
Service connection needs three things: a current diagnosis, an in-service event, and a nexus that links them. This shows which one the Board most often found missing in denials. The example below uses PTSD.
- Open the Advanced view, then click the Explore button.
- In the Condition box, type your condition, like PTSD.
- Set Group by to Missing element (denials).
- Set Measure to Volume and Sort by to Volume.
- For modern results, set Appeals system to AMA-era only.
- Click Build chart.
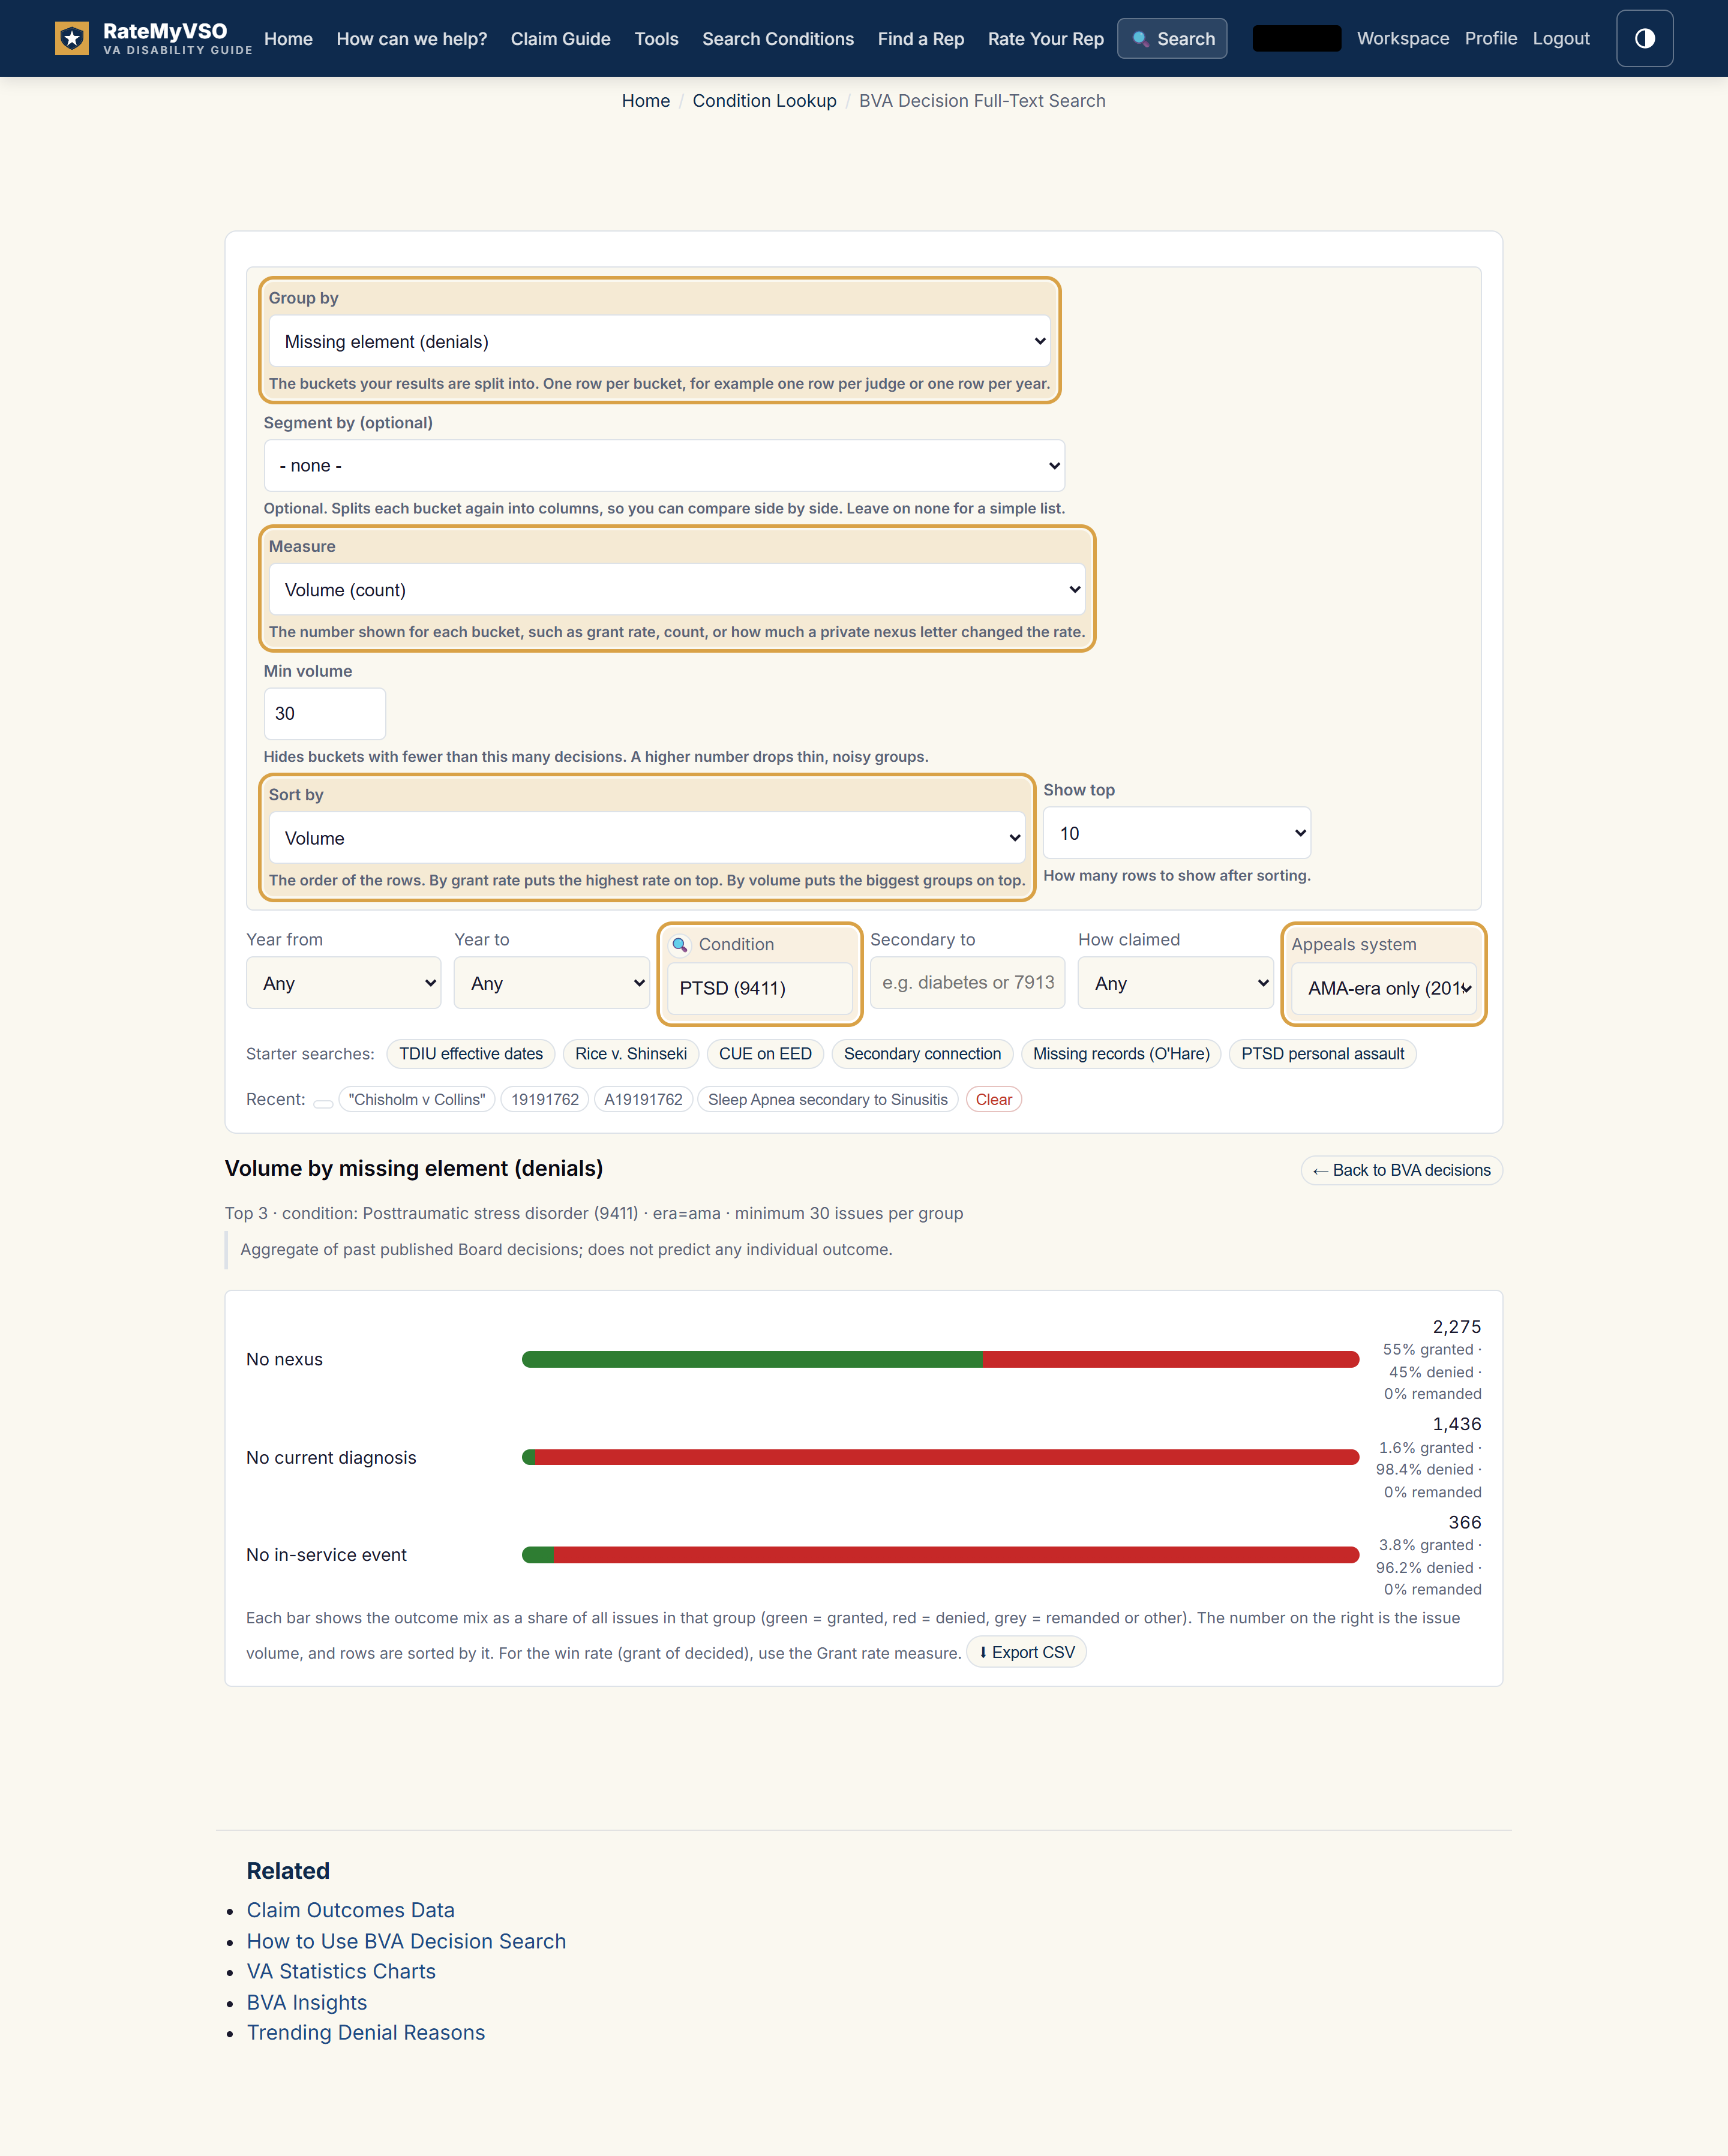
The Explore form set up for this question, with the fields you change highlighted, and the results below.
What you get: one row for each missing element, such as no current diagnosis or no nexus, with the most common at the top.
Read cases where the Board accepted the medical link
The Nexus finding filter pulls decisions by how the Board read the medical link on the issue you searched. Pair it with the "this issue" badge to see how each matched issue came out. The example below uses sleep apnea.
- Open the Advanced view and stay in the BVA decisions mode.
- In the Condition box, type your condition, like sleep apnea, and pick it from the list.
- Set Nexus finding to Positive (favorable nexus).
- For modern results, set Appeals system to AMA-era only.
- Click Search decisions.
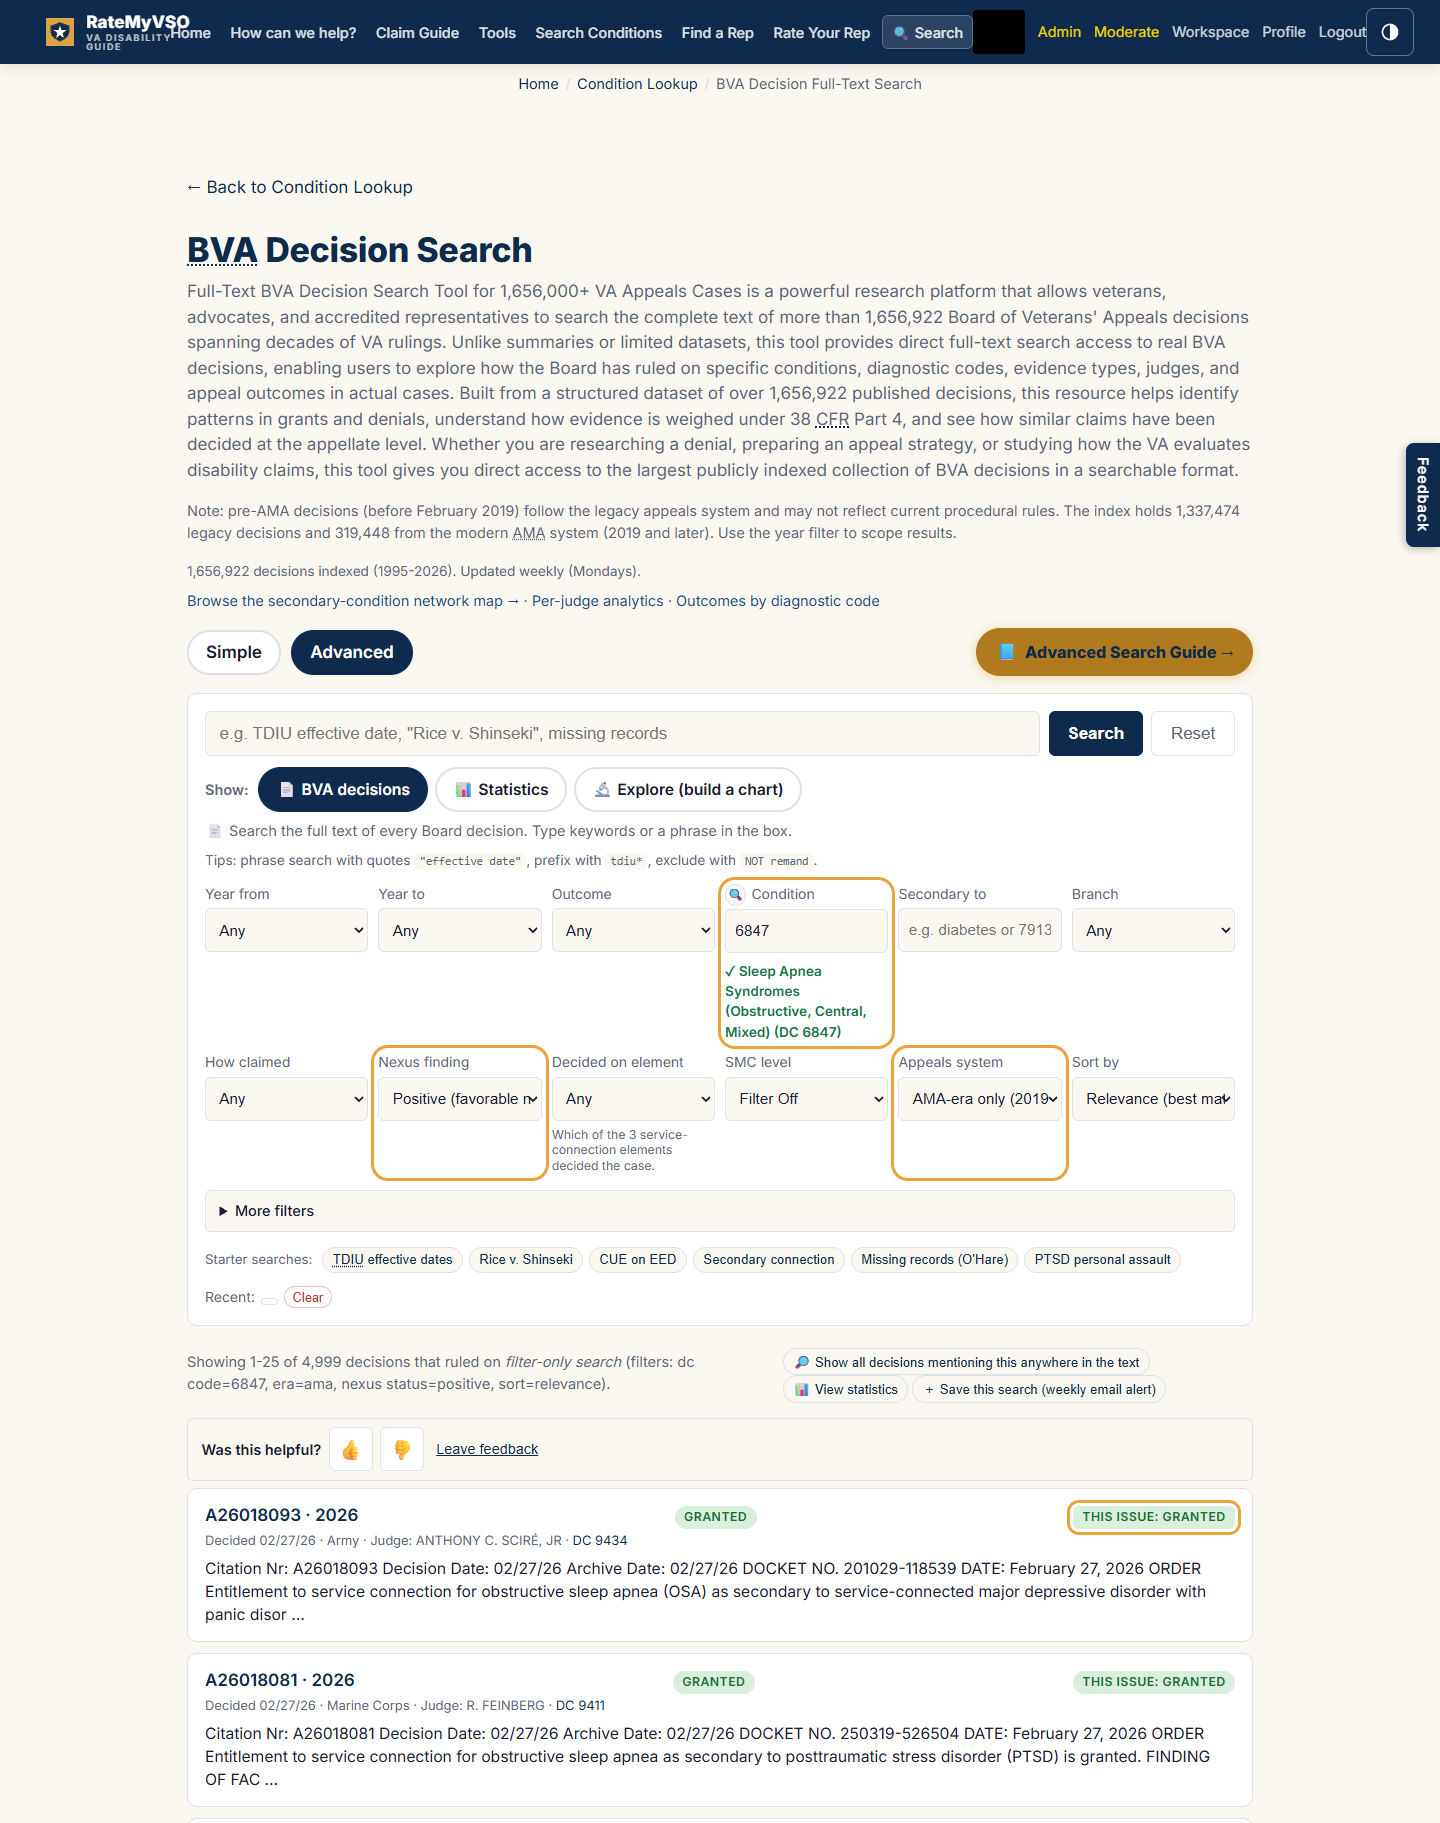
The decisions list with the Nexus finding filter set. The highlighted badge shows how the searched issue itself came out.
What you get: decisions where the Board found the medical link in the veteran's favor on that condition. Each result carries a "this issue" badge, because a decision marked mixed can still have granted the issue you searched.
Read denials that turned on the nexus element
When the Board denies service connection, one of the three elements was found missing. This recipe pulls denials where the nexus, the link between the condition and service, was the deciding element. The example below uses PTSD.
- Open the Advanced view and stay in the BVA decisions mode.
- In the Condition box, type your condition, like PTSD, and pick it from the list.
- Set Outcome to Denied.
- Set Decided on element to Nexus (the link).
- For modern results, set Appeals system to AMA-era only.
- Click Search decisions.
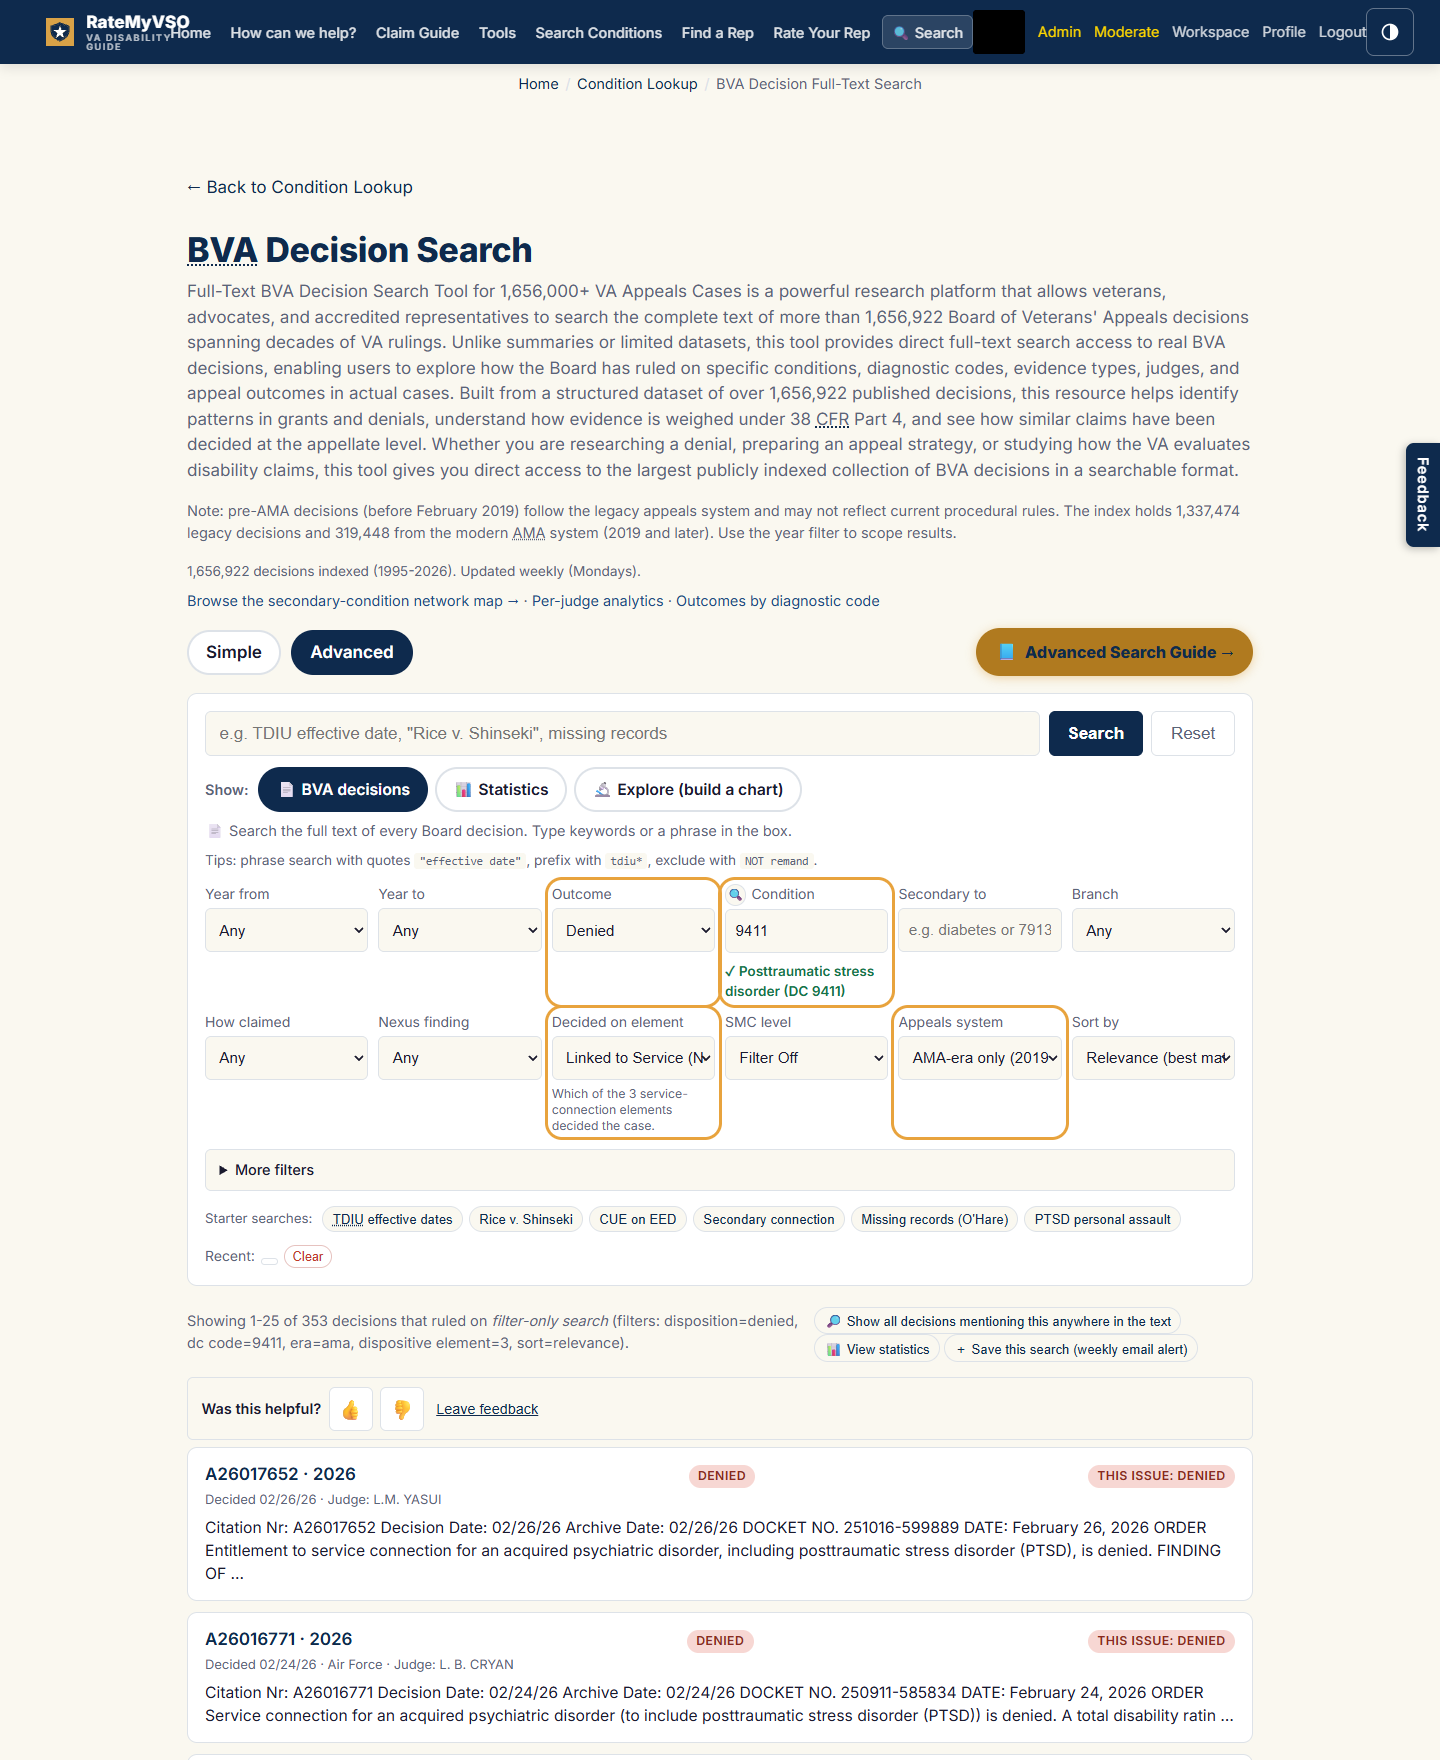
Denied PTSD decisions where the nexus was the deciding element.
What you get: real denials that turned on the medical link. Reading them shows the reasoning the Board used in past cases. It is research, not a checklist for your own claim.
Read SMC decisions at one level
Special Monthly Compensation has lettered levels, SMC-K through SMC-T. The SMC level filter pulls decisions that ruled on one level. The example below uses SMC-S, the housebound rate.
- Open the Advanced view and stay in the BVA decisions mode.
- Set SMC level to SMC-S.
- Click Search decisions.
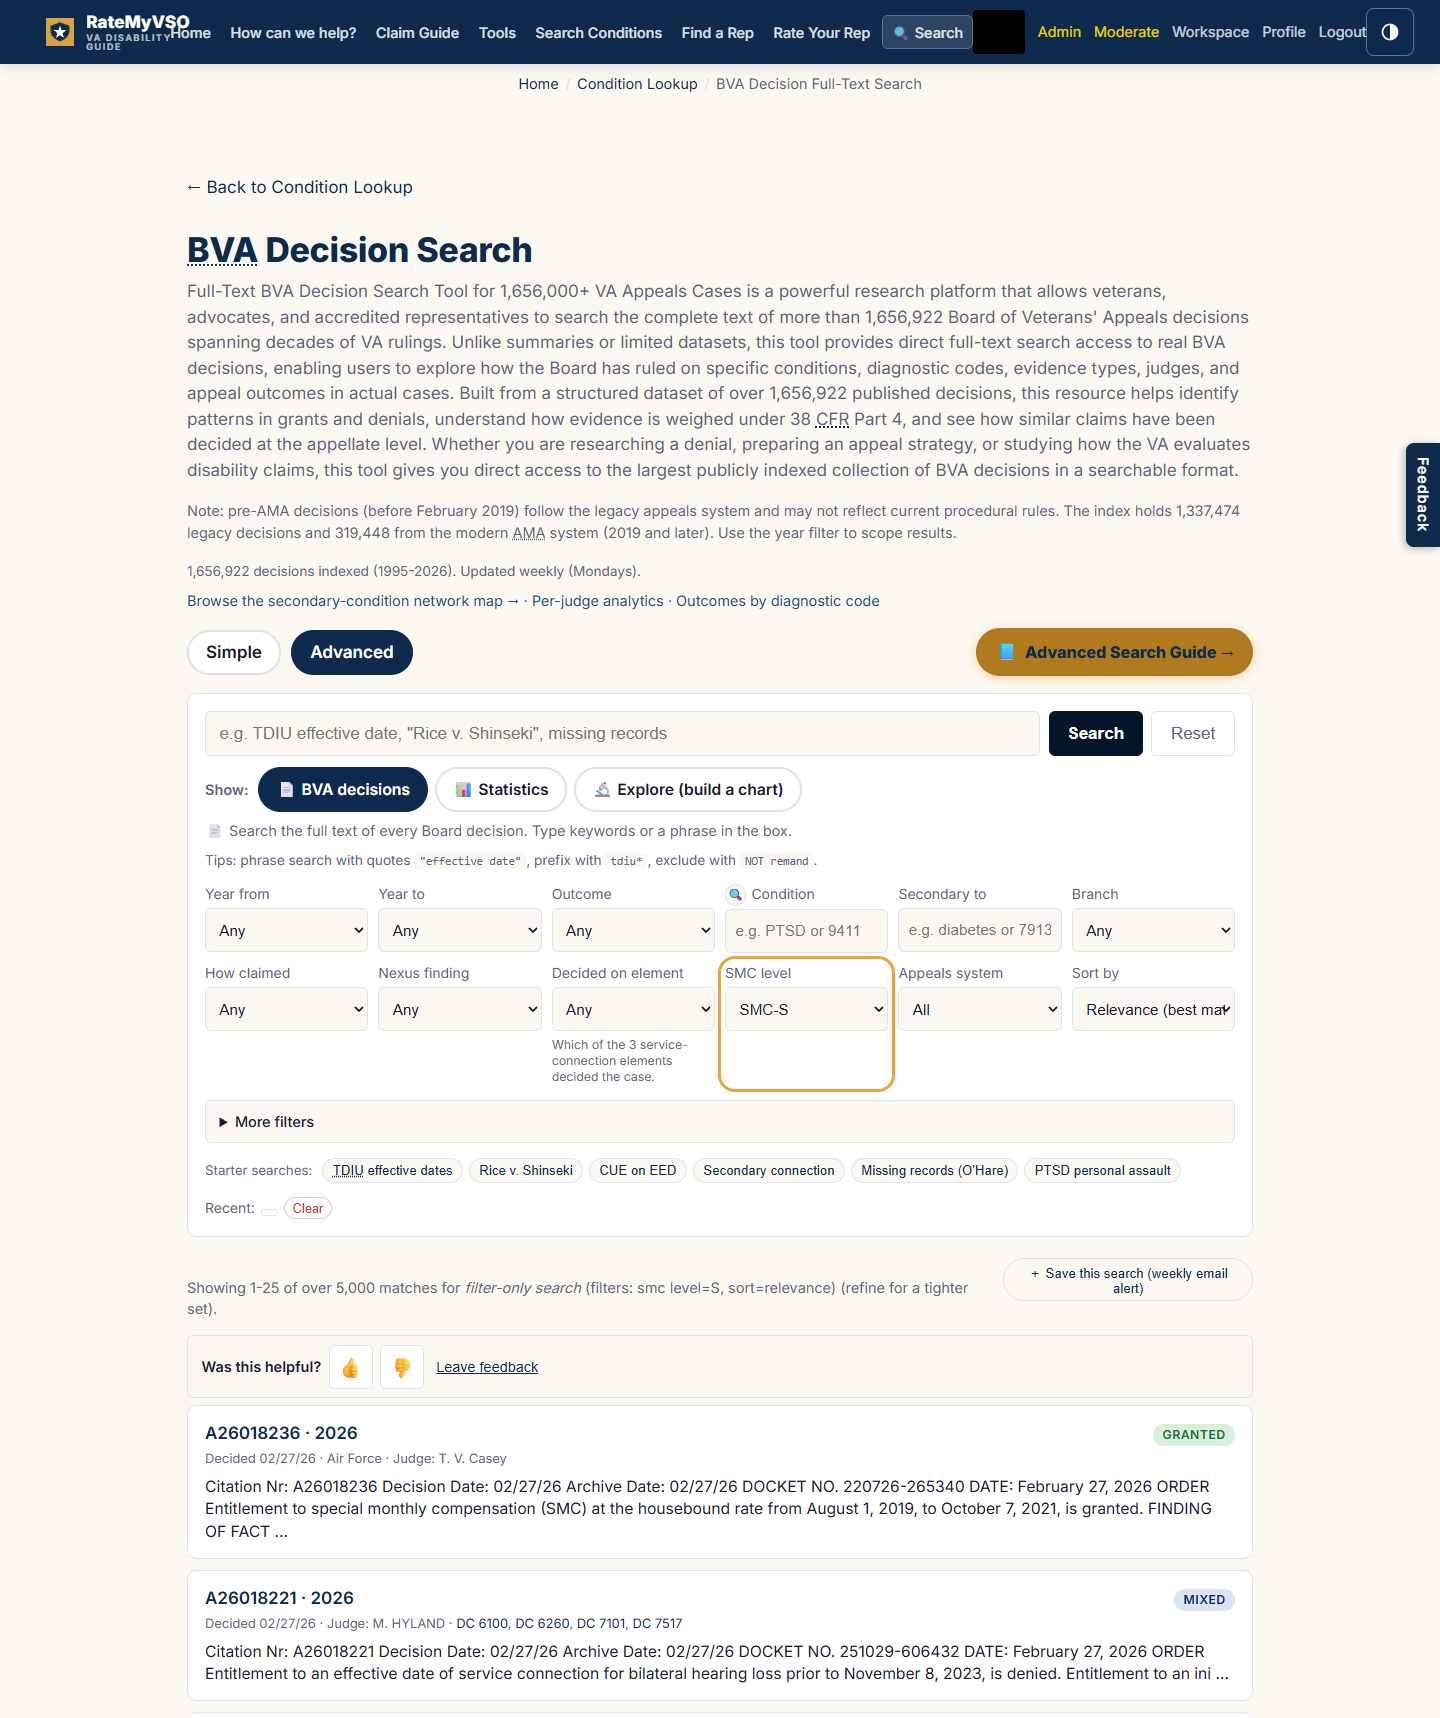
Decisions that ruled on SMC-S.
What you get: decisions from our analyzed SMC set. The specific levels are search-only; for an all-years count of any SMC, pick "Any SMC Level" instead, which also works in Statistics.
Read toxic-exposure decisions for one exposure type
The Presumption or exposure checkboxes pull decisions involving one exposure type, such as burn pits or Agent Orange, across all years. The example below uses burn pits.
- Open the Advanced view and stay in the BVA decisions mode.
- Open the More filters panel.
- Under Presumption or exposure, check Burn pits.
- Click Search decisions.
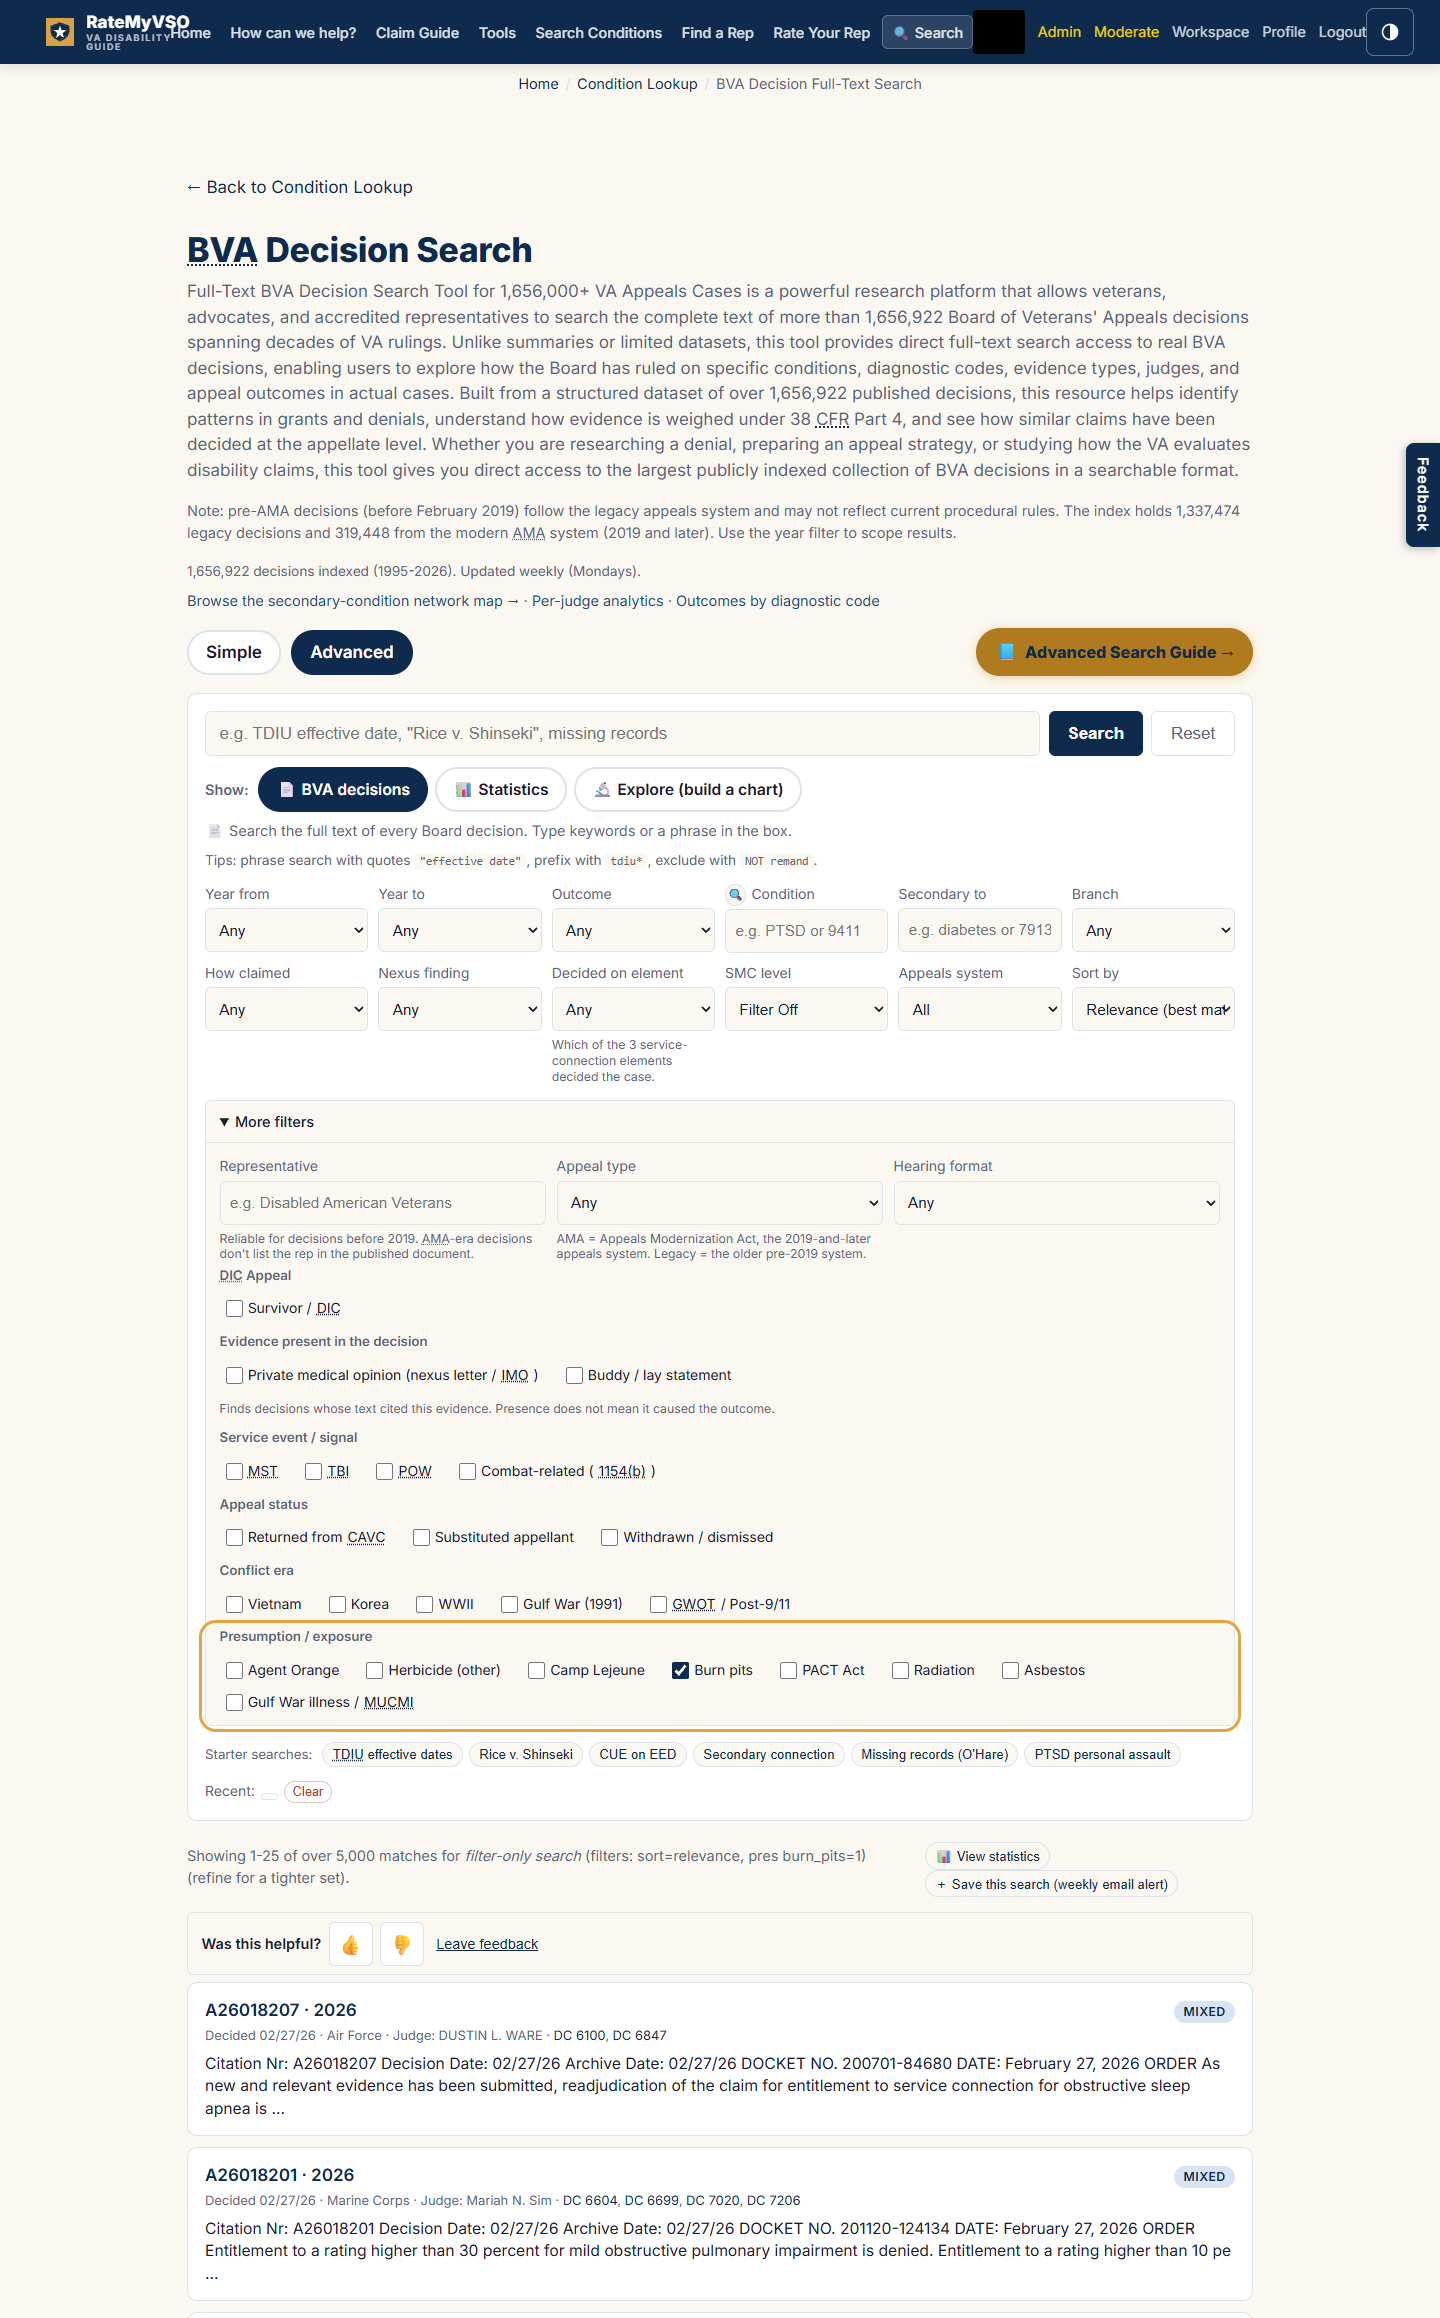
Burn pit decisions, from the all-years presumption checkboxes.
What you get: decisions involving that exposure, across the full archive. These checkboxes also work in Statistics and Explore.
Find decisions where specific evidence was in the record
The Evidence present checkboxes pull decisions whose text cited a piece of evidence, such as a private medical opinion or a buddy statement. The example below uses tinnitus with both boxes checked.
- Open the Advanced view and stay in the BVA decisions mode.
- In the Condition box, type your condition, like tinnitus, and pick it from the list.
- Open the More filters panel.
- Under Evidence present in the decision, check Private medical opinion (nexus letter / IMO) and Buddy / lay statement.
- For modern results, set Appeals system to AMA-era only.
- Click Search decisions.
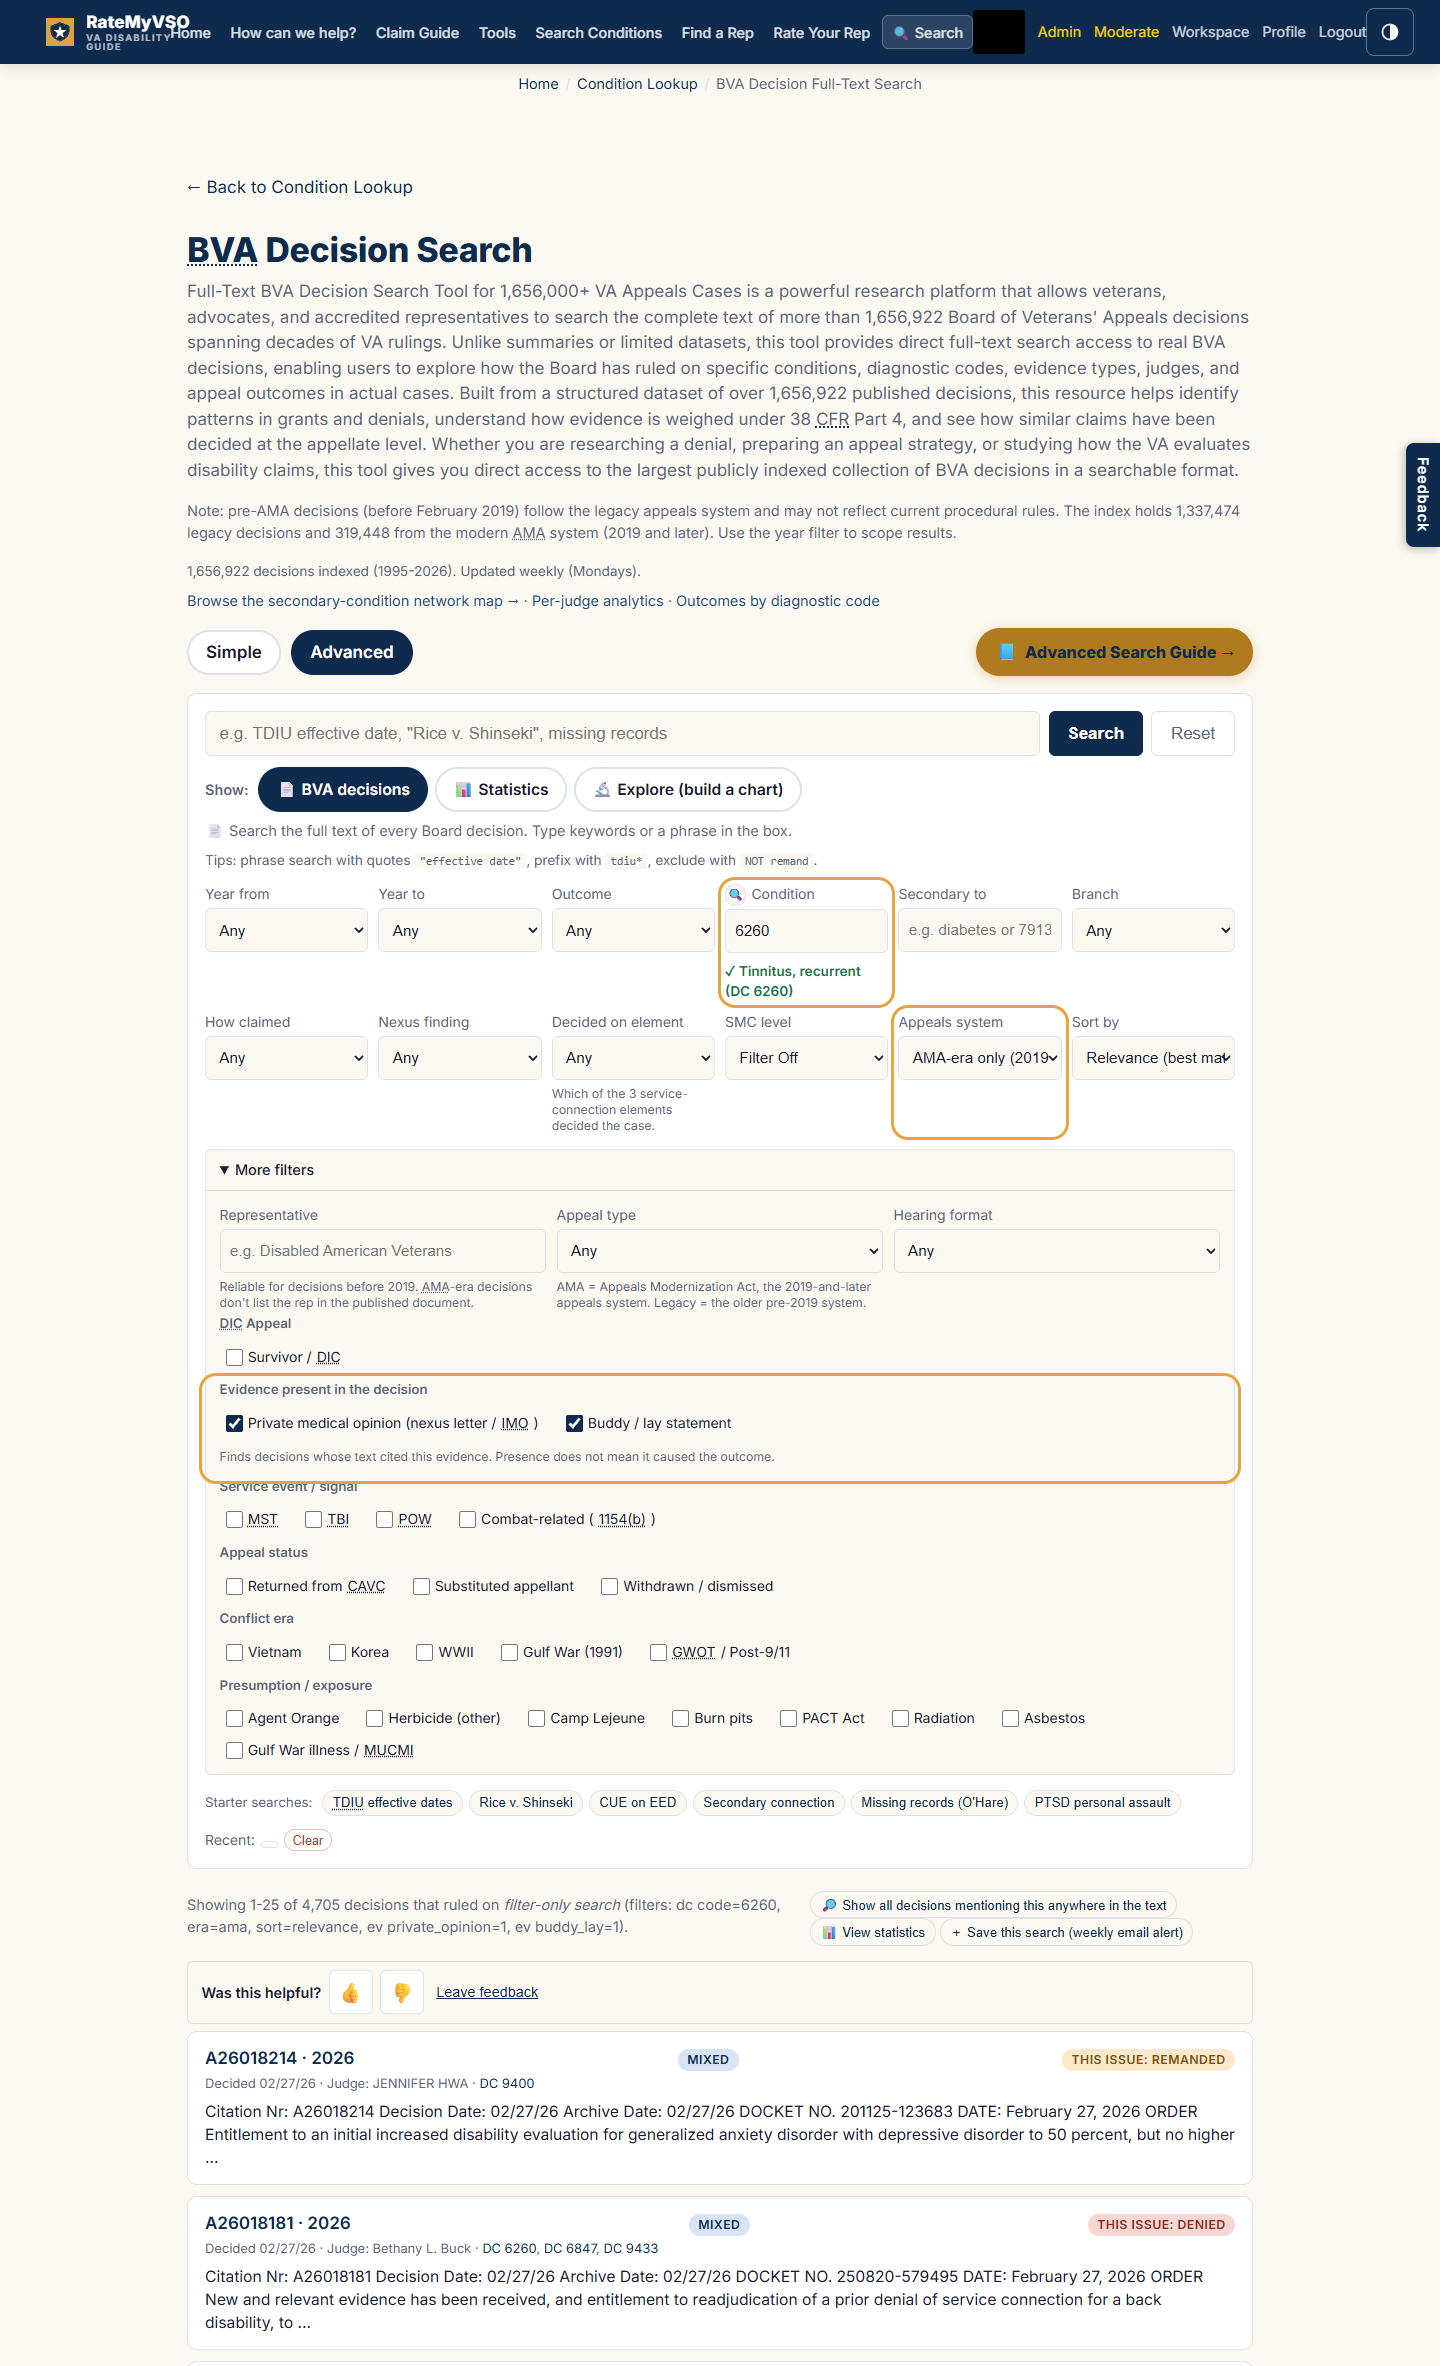
Tinnitus decisions whose text cited both a private medical opinion and a buddy or lay statement.
What you get: decisions where that evidence appeared in the record. Presence does not mean the evidence caused the outcome.
Modern Decisions vs Older Ones
Prefer decisions from 2019 and later. VA regulations and court rulings change over time, so an old decision may rest on rules that no longer apply. The Appeals Modernization Act took effect in February 2019 and reshaped how appeals work. Newer decisions reflect today's law more closely.
- In the Simple view: the Decisions pills at the top set this. Modern Era Only (2019 to present) is on by default; switch to All decisions (1992 - 2026) to include older ones.
- In the Advanced view: use the Appeals system filter for AMA-era only, Legacy, or all. You can also set Year from and Year to for a tighter window.
What These Numbers Are, and Are Not
Everything in this tool describes decisions the Board has already issued. The rates are counts of past cases, grouped and reported. They are not a forecast of your appeal.
- Not a prediction. A high grant rate for a group does not mean your case will be granted. Each appeal turns on its own facts and evidence.
- Not legal advice. This tool reports patterns. It does not tell you what to file or how to argue. For your own claim, work with a VA-accredited representative.
- Not binding precedent. Board decisions are not binding on other cases. Use them to understand how the Board has reasoned, not as a rule that controls your appeal.
Judge Research: How the Board's Judges Have Ruled
The Judge research mode reports how individual Veterans Law Judges have decided published cases. Board judges are public officials, and the decisions they sign are public records. This mode counts those decisions and reports the patterns: the grant rate for a condition, where a judge ranks among their peers, and how two judges compare. Everything here is past, published fact. It is research, not a prediction of your appeal, and you do not choose your judge.
Click the ⚖️ Judge research button in the Advanced view. What you fill in decides what you get:
- A condition alone: leave the Judge box empty and set a Condition. You get a leaderboard, the most-lenient and toughest judges on that condition, ranked by grant rate.
- A judge plus a condition: fill both for a deep dive. You get that judge's grant, denial, and remand split on the condition, where they rank among all judges, how a private nexus opinion moved their rate, and their recent grants and denials.
- A judge alone: fill only the Judge box for that judge's full record across every condition.
A Compare with box sits under the Judge box. Set a judge, a condition, and a second judge to put the two side by side on the same condition.
The most-lenient and toughest judges for a condition
Leave the Judge box empty and set only a Condition. The tool ranks every judge with at least 20 decided issues on that condition, highest grant rate and lowest. The example below uses PTSD.
- Open the Advanced view, then click the ⚖️ Judge research button.
- Leave the Judge box empty.
- In the Condition box, type PTSD and pick it from the list.
- Optional: check Active judges only to limit the list to judges still deciding cases in the latest data year.
- For modern results, set Appeals system to AMA-era only.
- Click Research this judge.
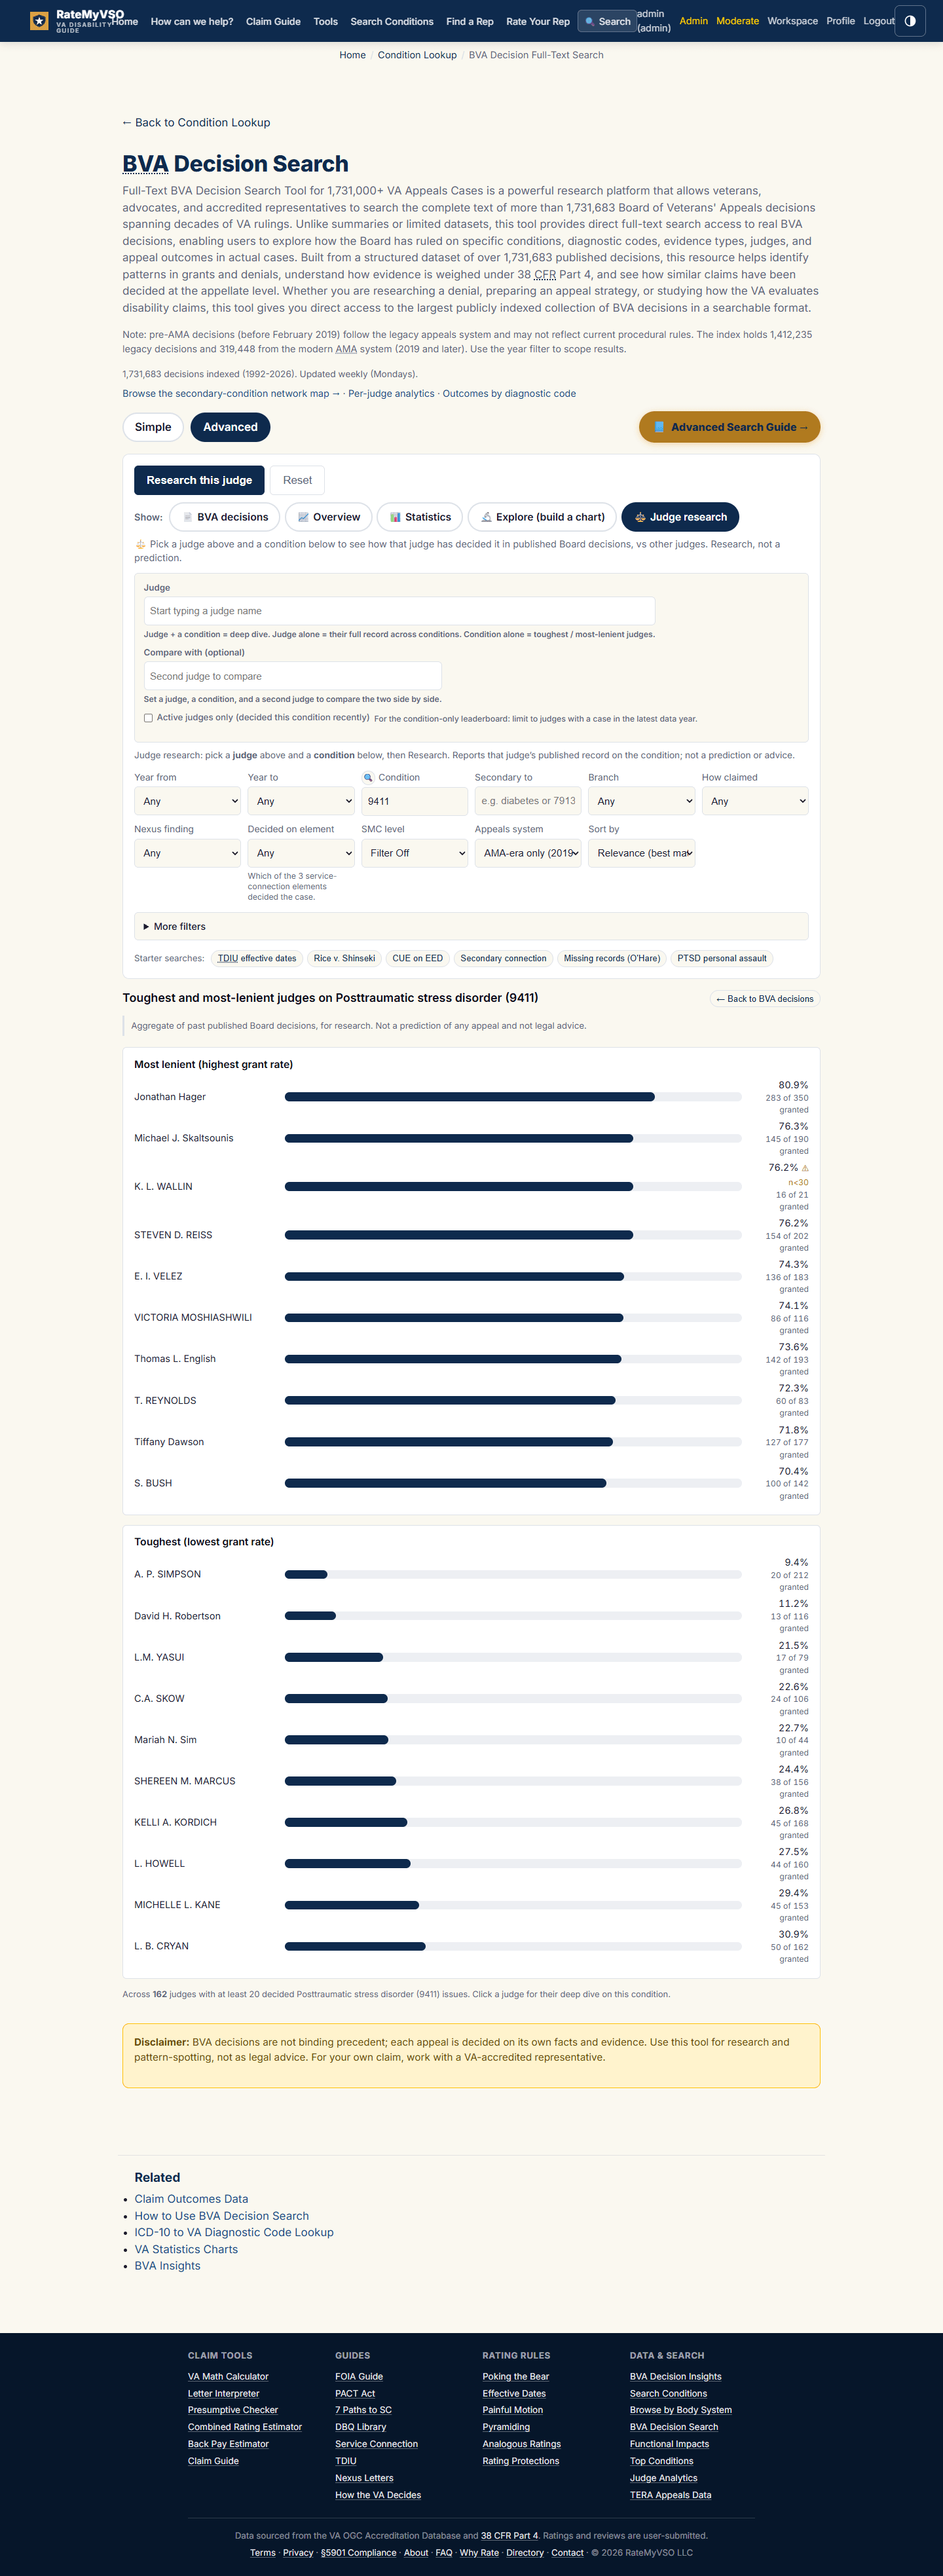
The condition-only leaderboard for PTSD. Most-lenient judges on top, toughest below, each with a grant-rate bar and the granted-of-total count.
What you get: two ranked lists for that condition, the highest grant rates and the lowest, with each judge's case count beside the rate. The footer shows how many judges met the minimum. Click any judge to open their deep dive on that condition.
How one judge has ruled on a condition, and where they rank
Fill both the Judge box and the Condition box for a deep dive on that pair. The example below is a judge on PTSD.
- Open the Advanced view, then click the ⚖️ Judge research button.
- In the Judge box, start typing the judge's name and pick it from the list.
- In the Condition box, type PTSD and pick it from the list.
- For modern results, set Appeals system to AMA-era only.
- Click Research this judge.
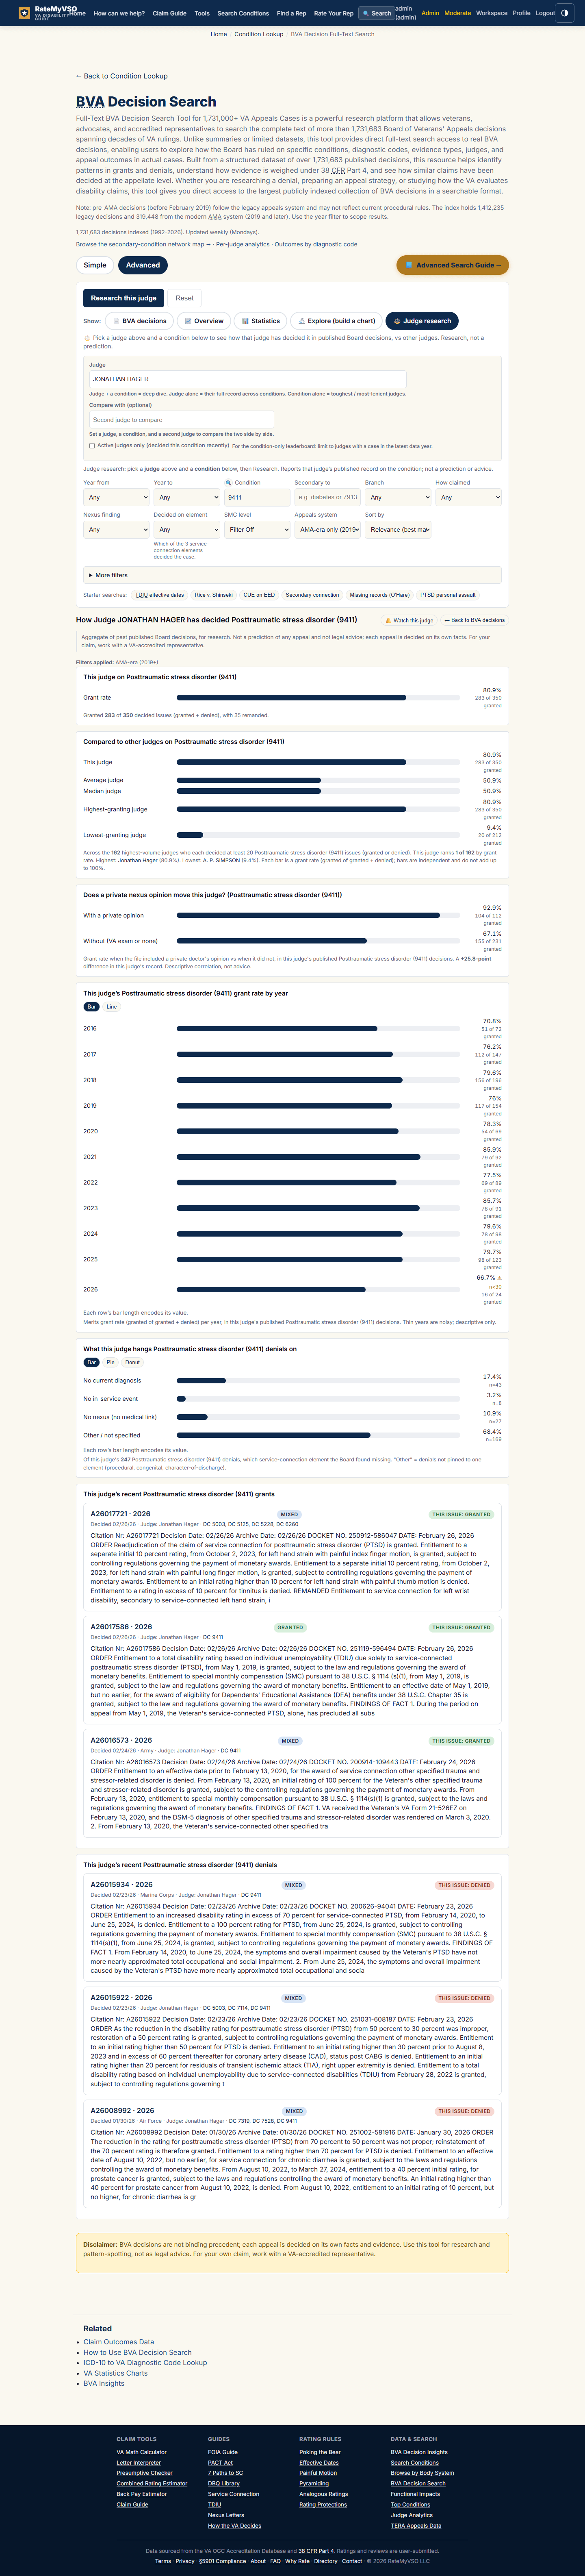
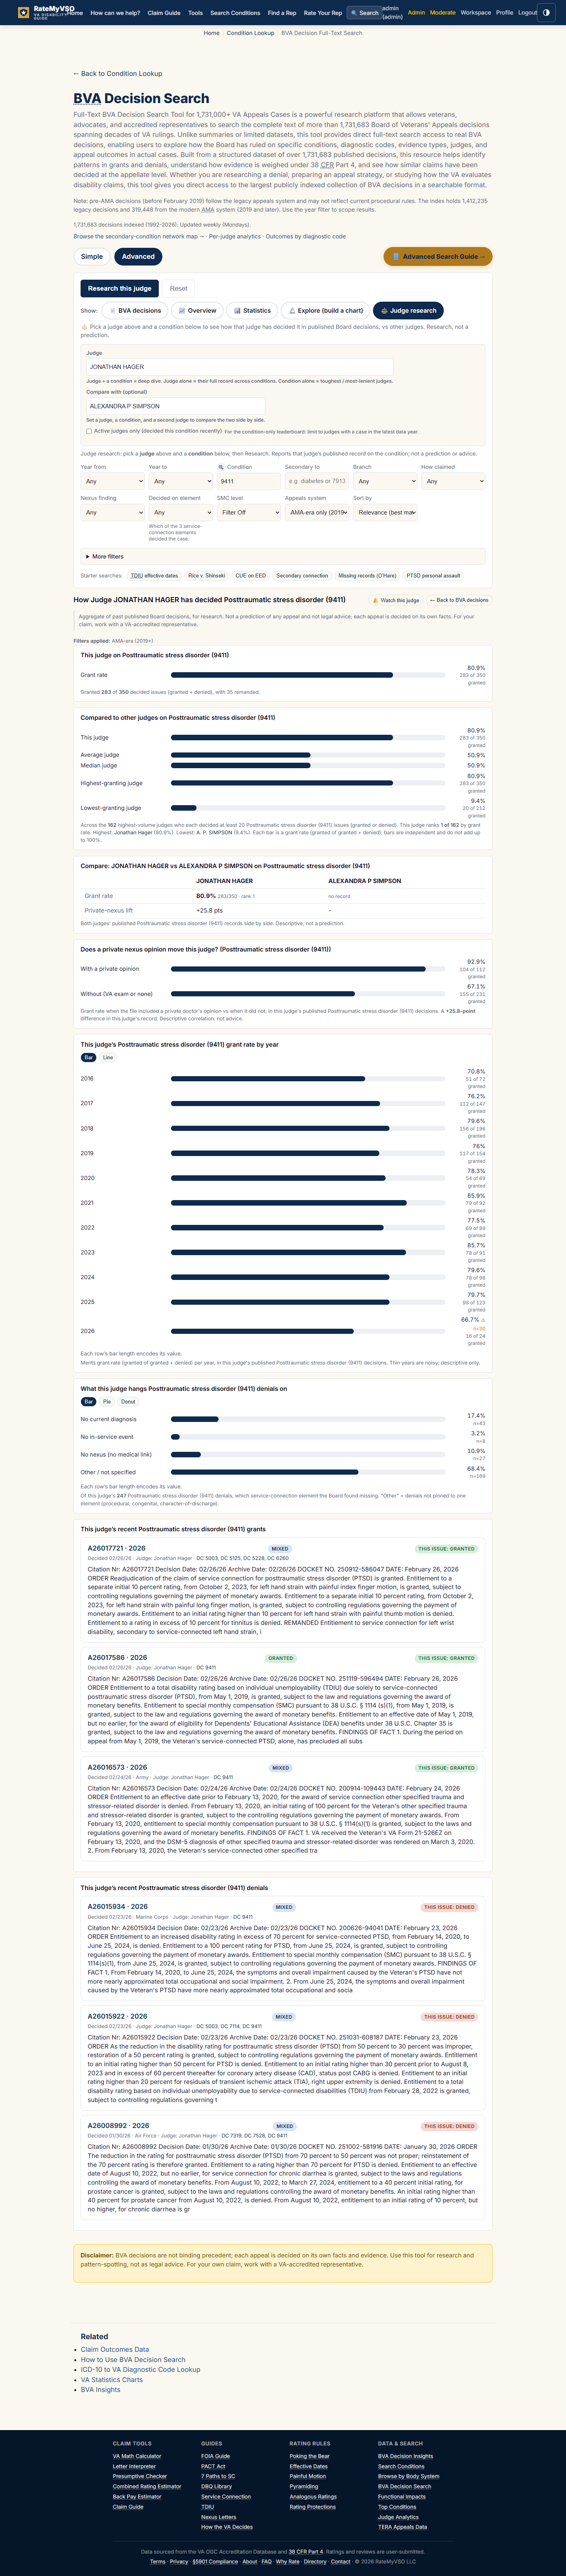
A judge deep dive on PTSD: the grant, denial, and remand split, the judge's rank among all judges on the condition, and recent decisions you can open.
What you get: that judge's grant, denial, and remand rate for the condition, their rank out of all qualifying judges, the field median, how much a private nexus opinion shifted their rate, and a few recent grants and denials you can read in full. Signed-in users also get a Watch this judge button for a weekly email of new decisions by that judge on that condition.
Compare two judges on the same condition
Set a judge, a condition, and a second judge in the Compare with box. The example below compares two judges on PTSD.
- Open the Advanced view, then click the ⚖️ Judge research button.
- In the Judge box, pick the first judge.
- In the Condition box, type PTSD and pick it from the list.
- In the Compare with box, pick the second judge.
- For modern results, set Appeals system to AMA-era only.
- Click Research this judge.
Two judges side by side on PTSD, each with their grant rate, rank, and case count.
What you get: the two judges next to each other on the same condition, each with their grant rate, their rank, and how many cases the rate rests on. Read it as a factual comparison of past decisions, not a verdict on either judge.
Frequently Asked Questions
Do I need an account to search?
What is the difference between Statistics and Explore?
How do I find what my condition is often claimed secondary to?
Why should I limit to decisions from 2019 and later?
Does a high grant rate mean my claim will be granted?
What does private-nexus lift mean?
Can I see which judges grant my condition most often?
Is it fair to rank a judge by grant rate?
Related Tools and Guides
Disclaimer: BVA decisions are not binding precedent. Each appeal is decided on its own facts and evidence. Use this tool for research and pattern-spotting, not as legal advice, and not as a prediction of any individual claim. For help with your claim, find a VA-accredited representative.