SMC Visual Guide Library
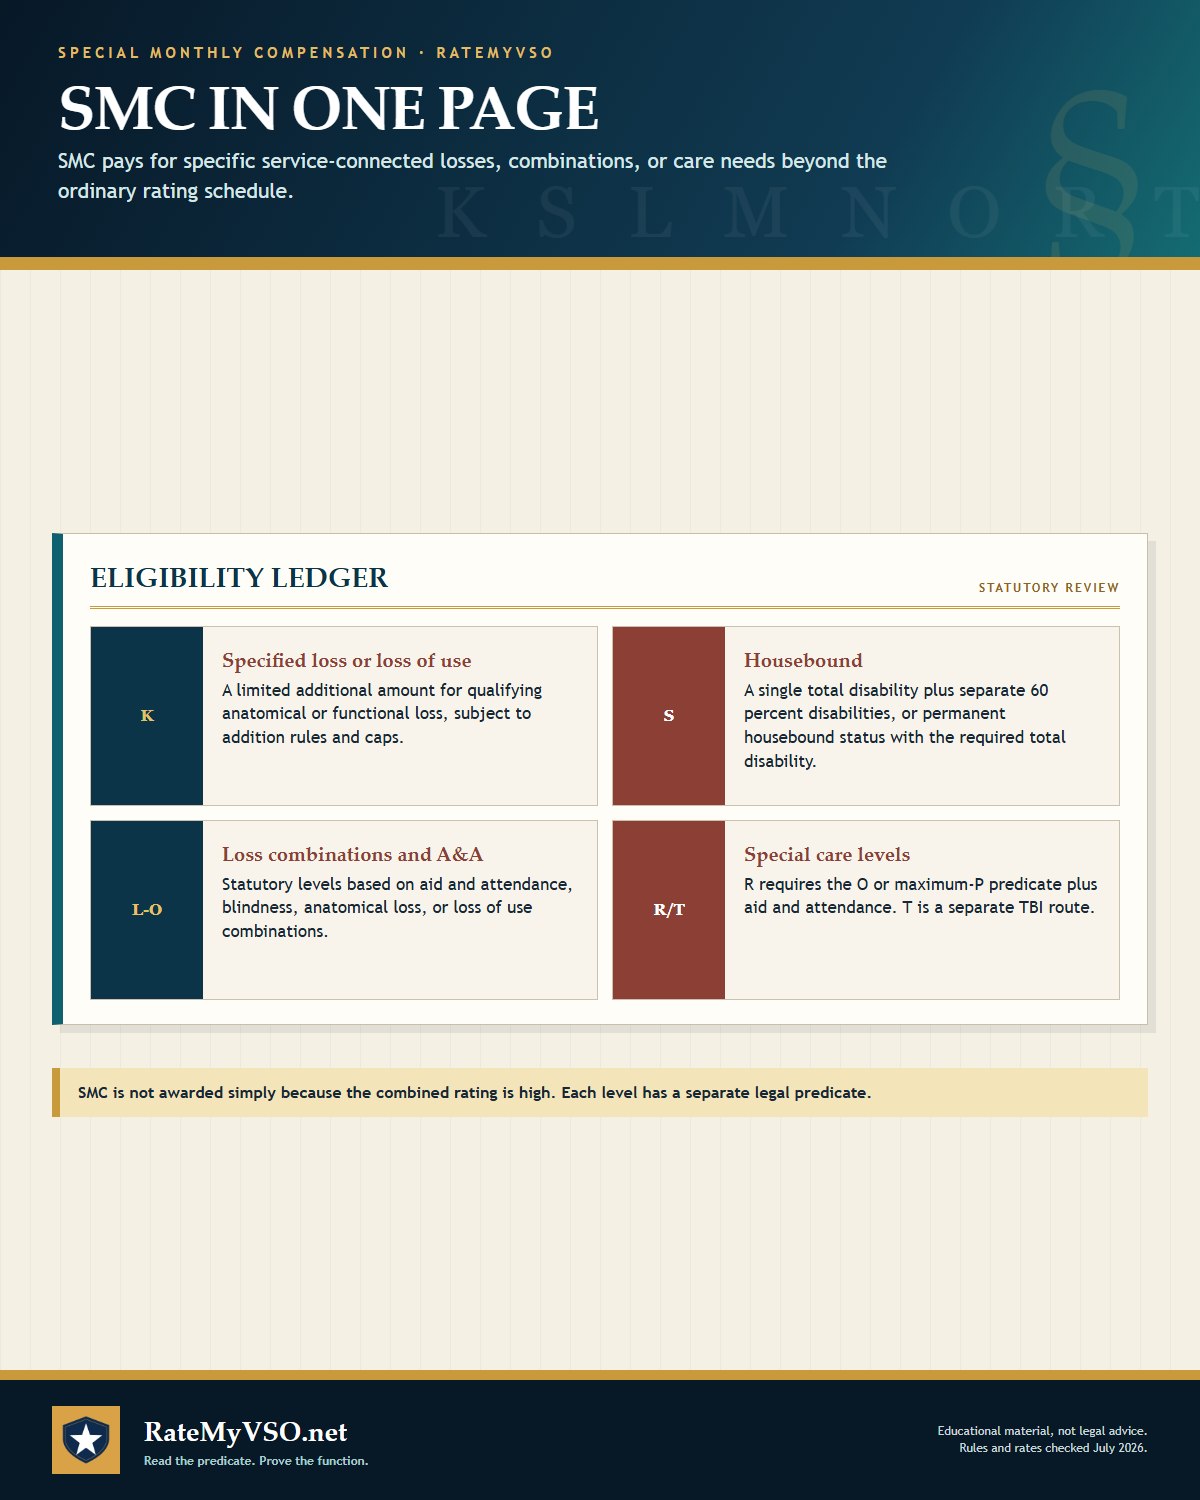
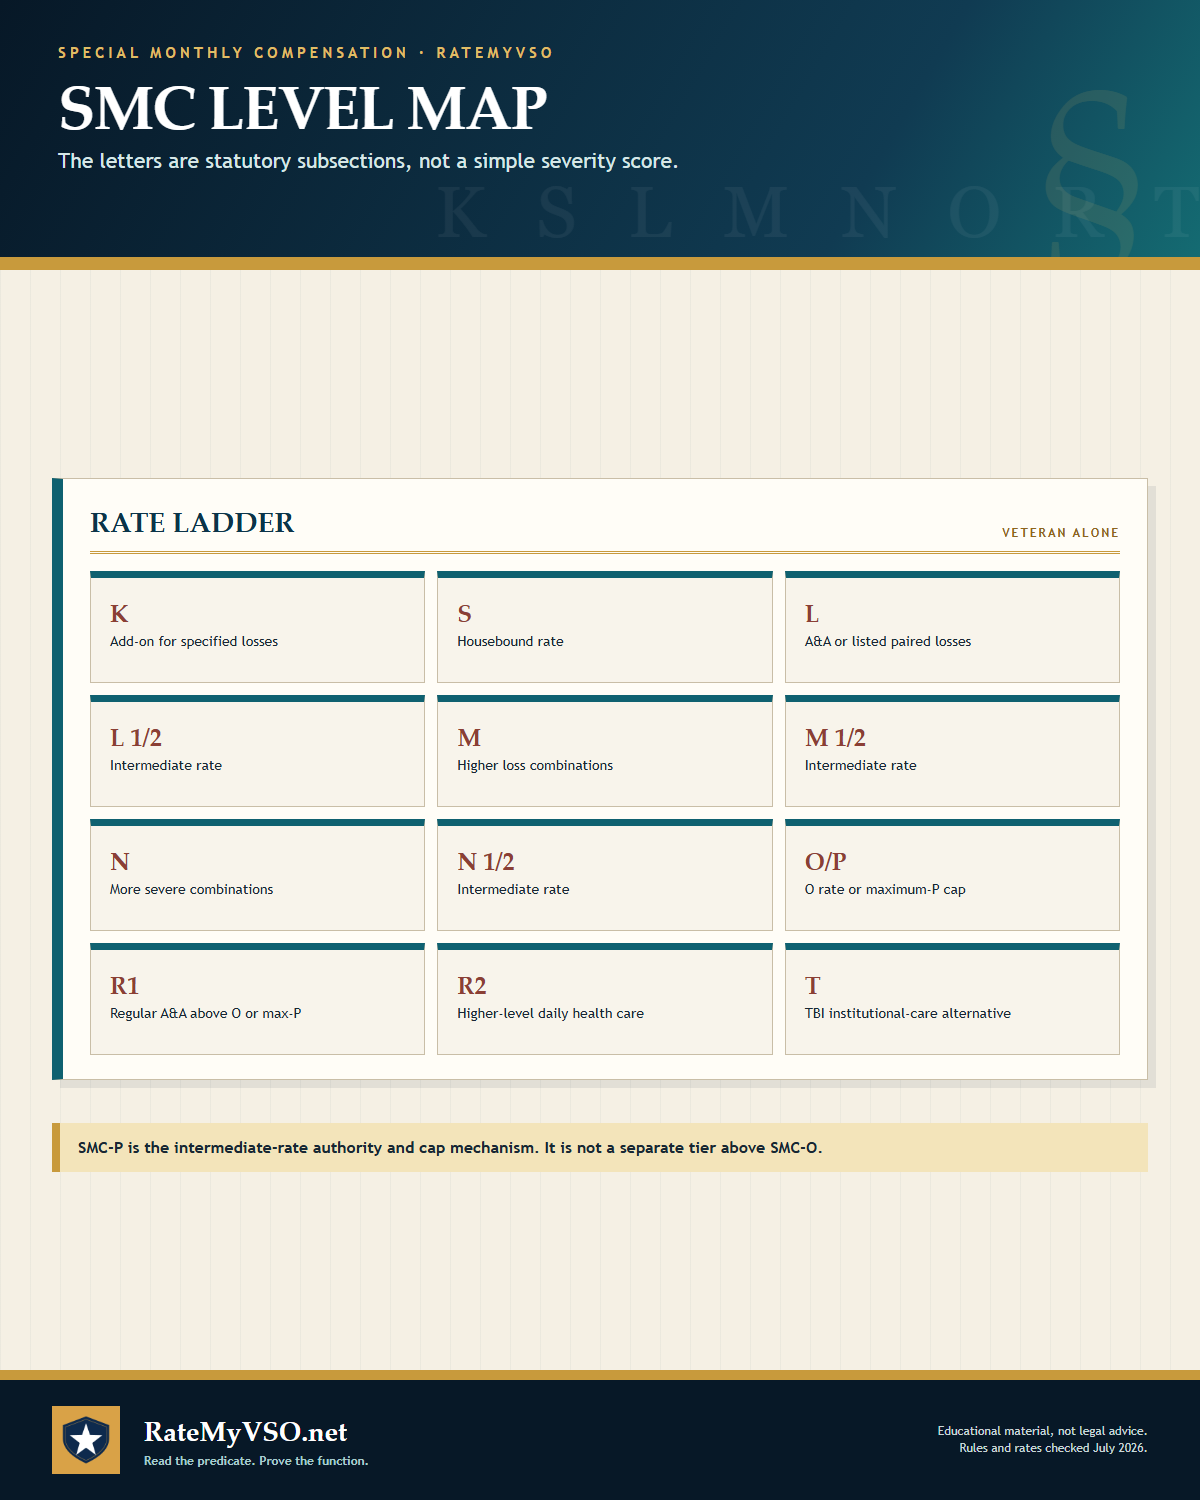
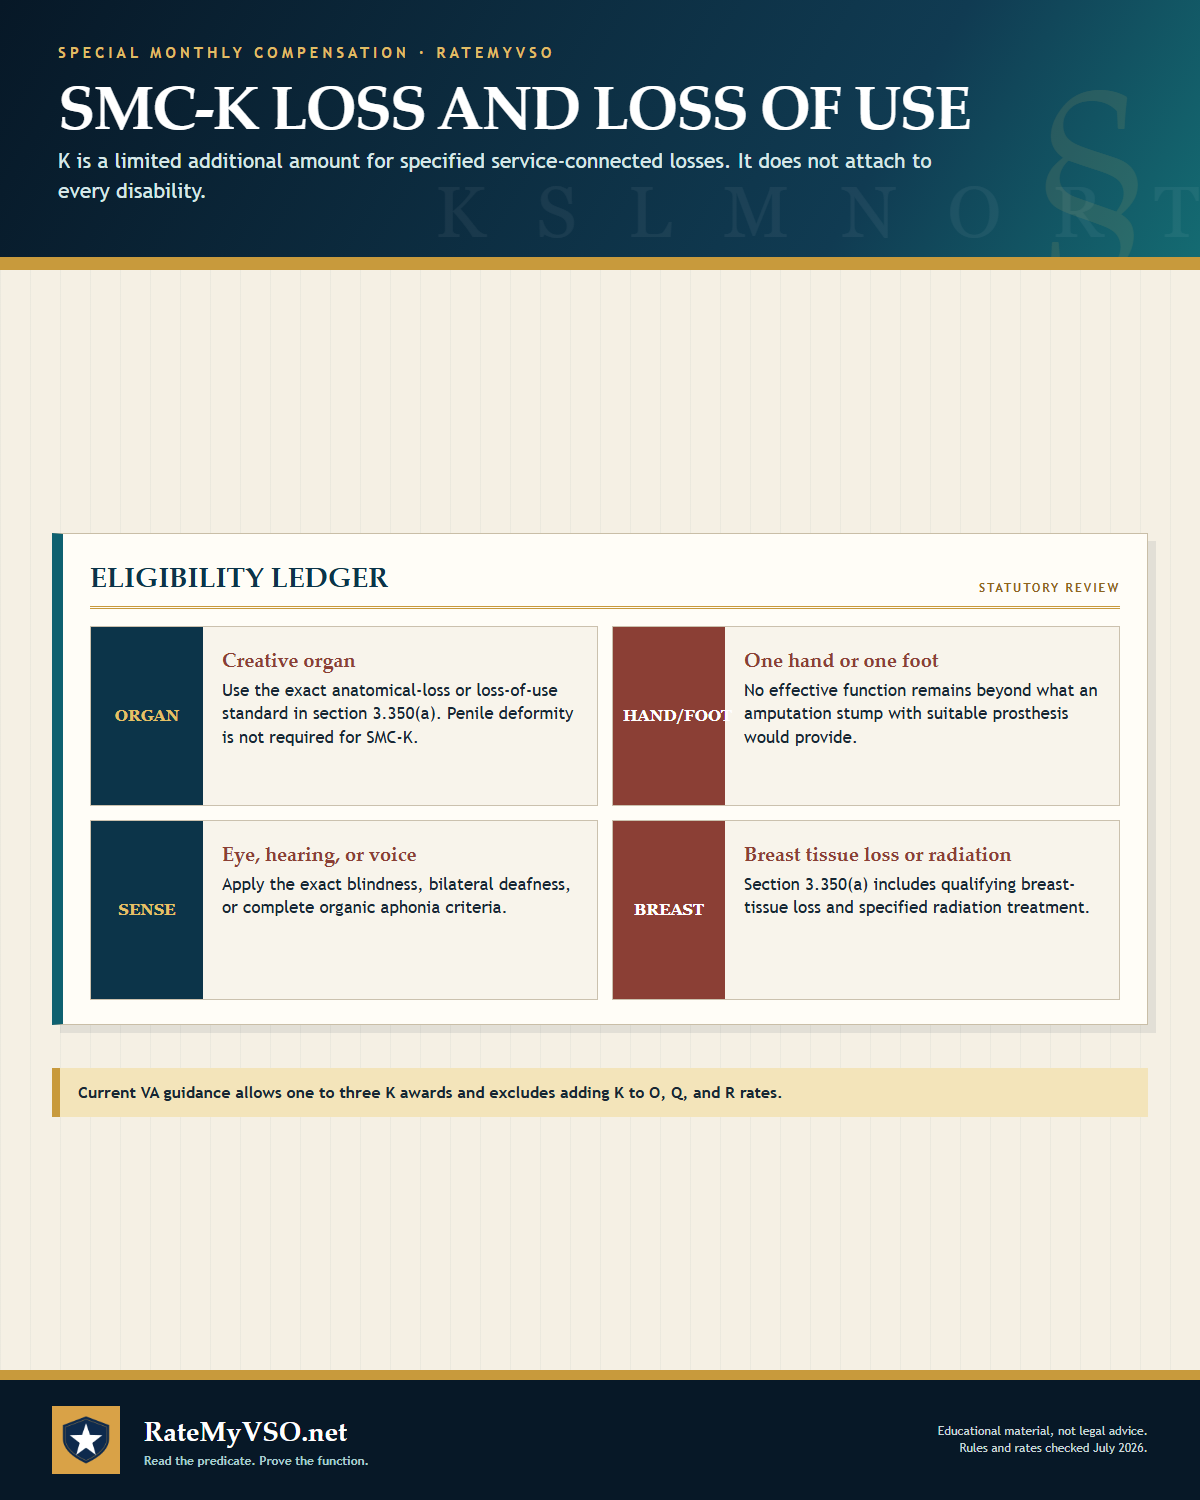
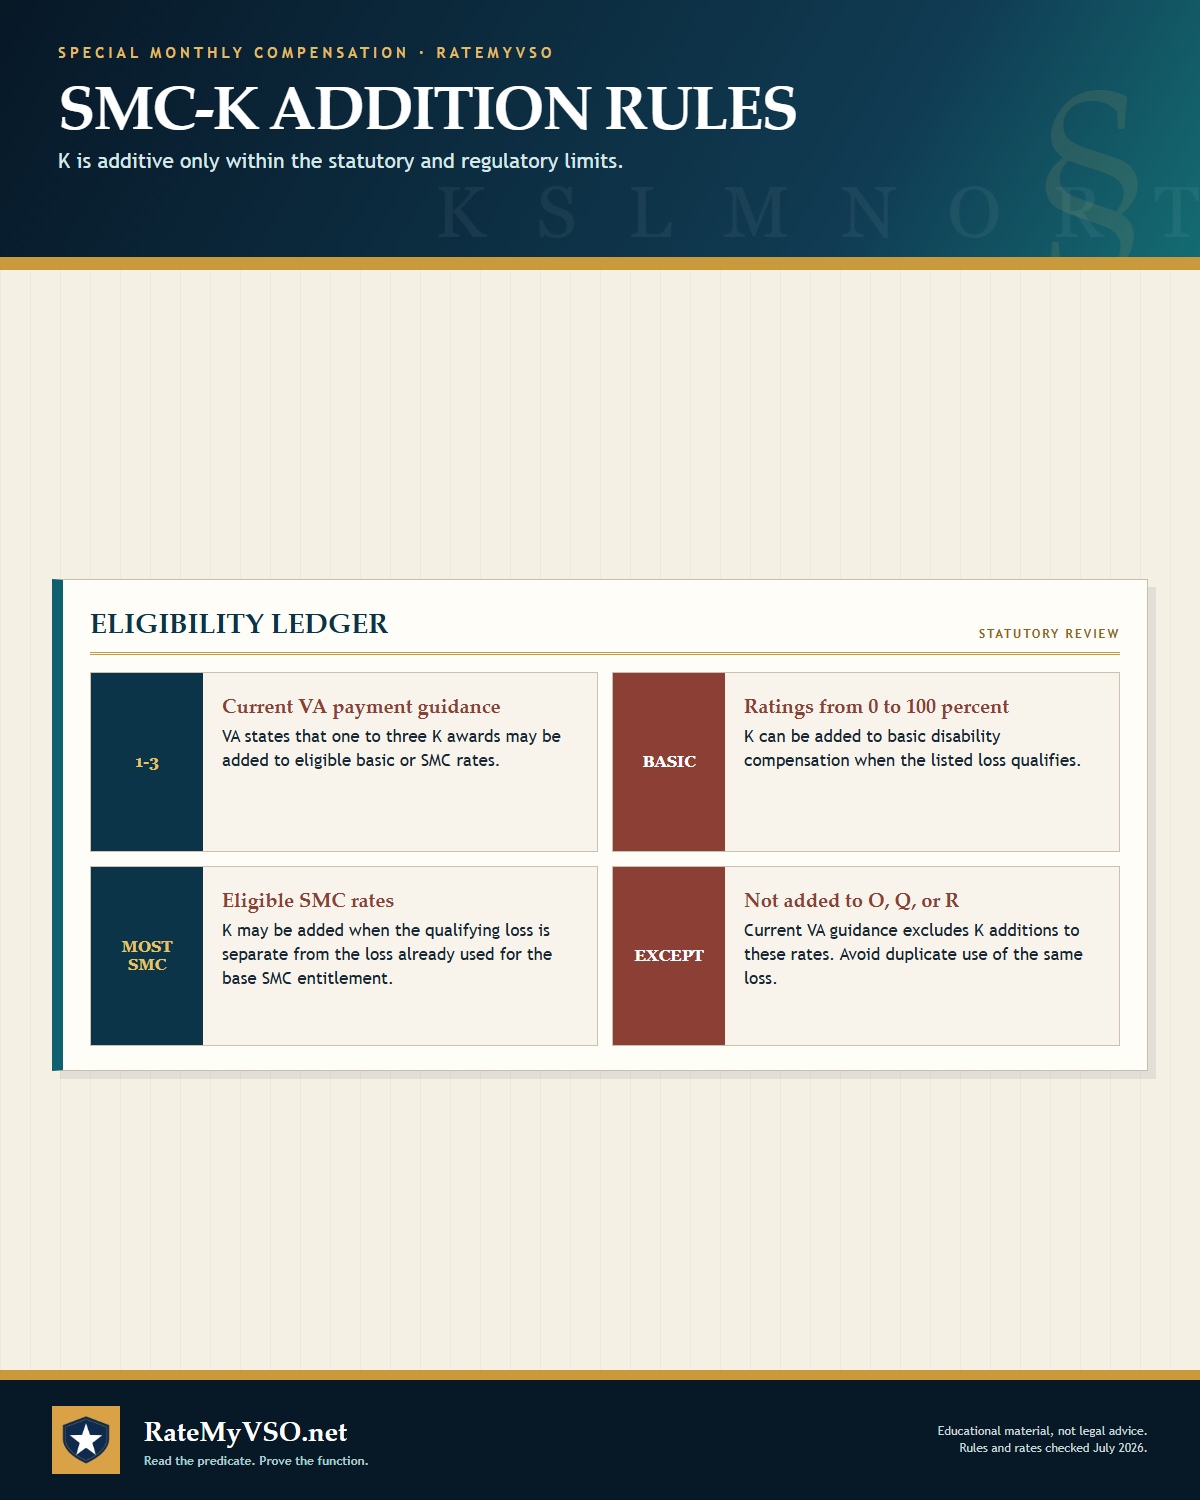
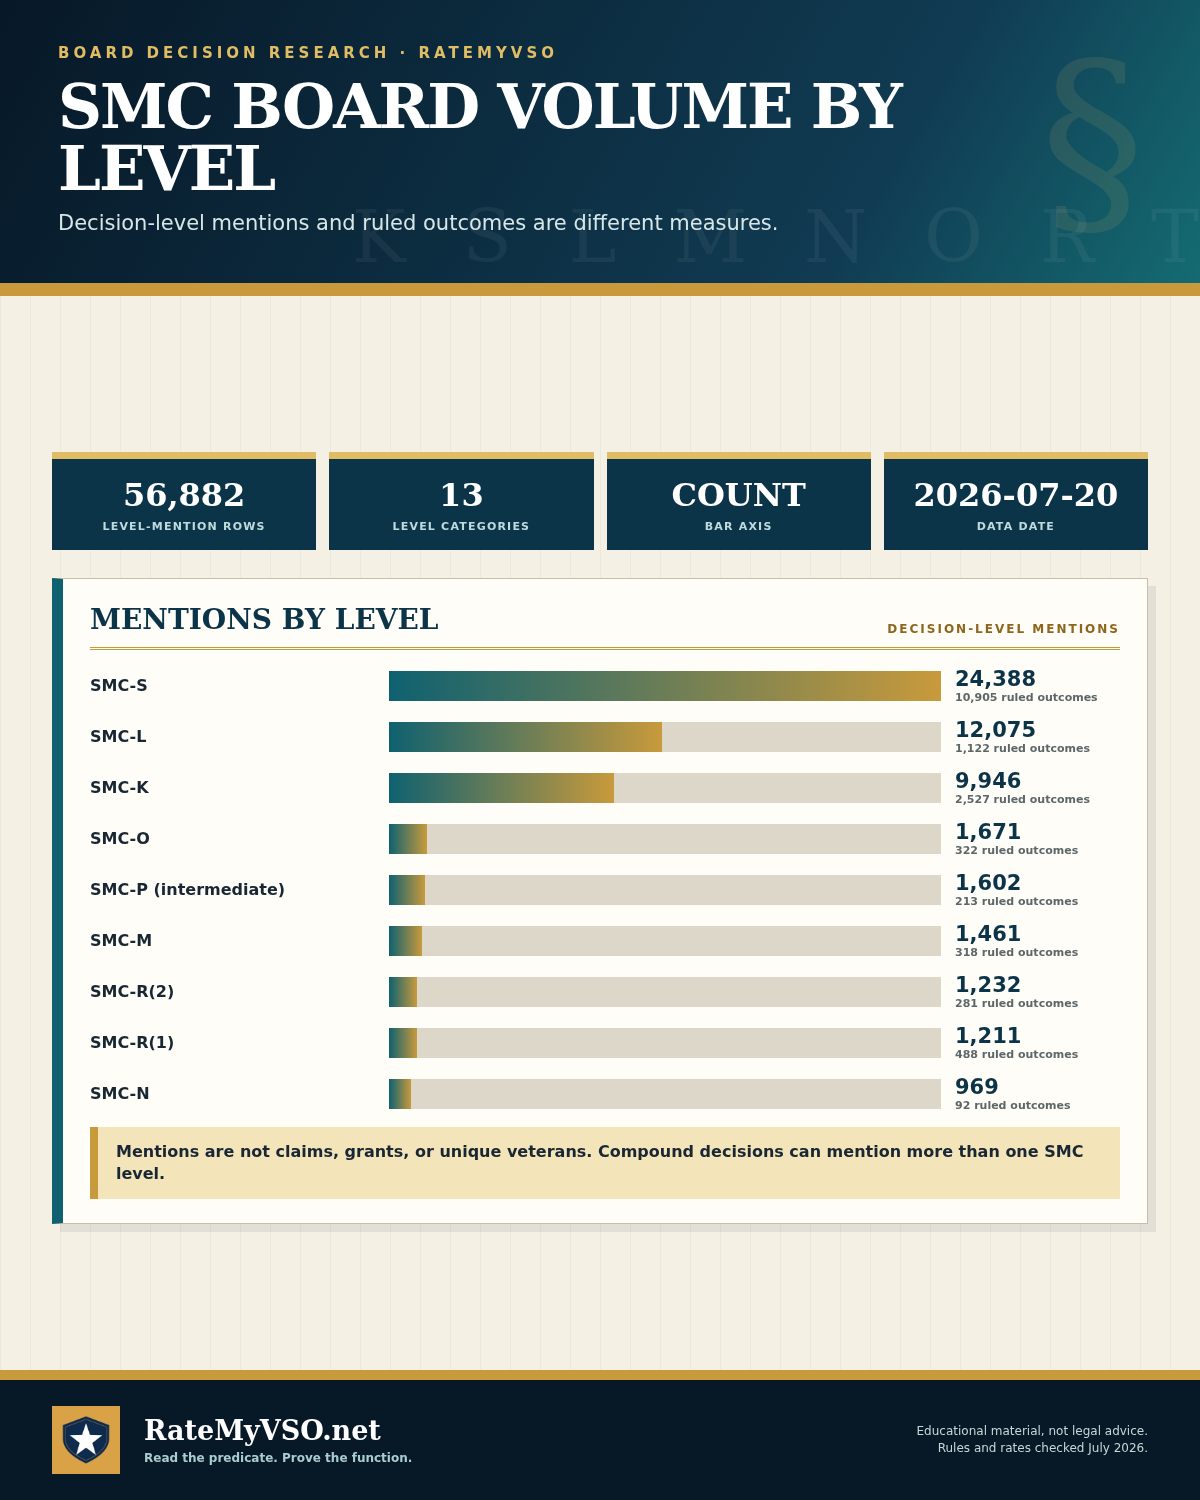
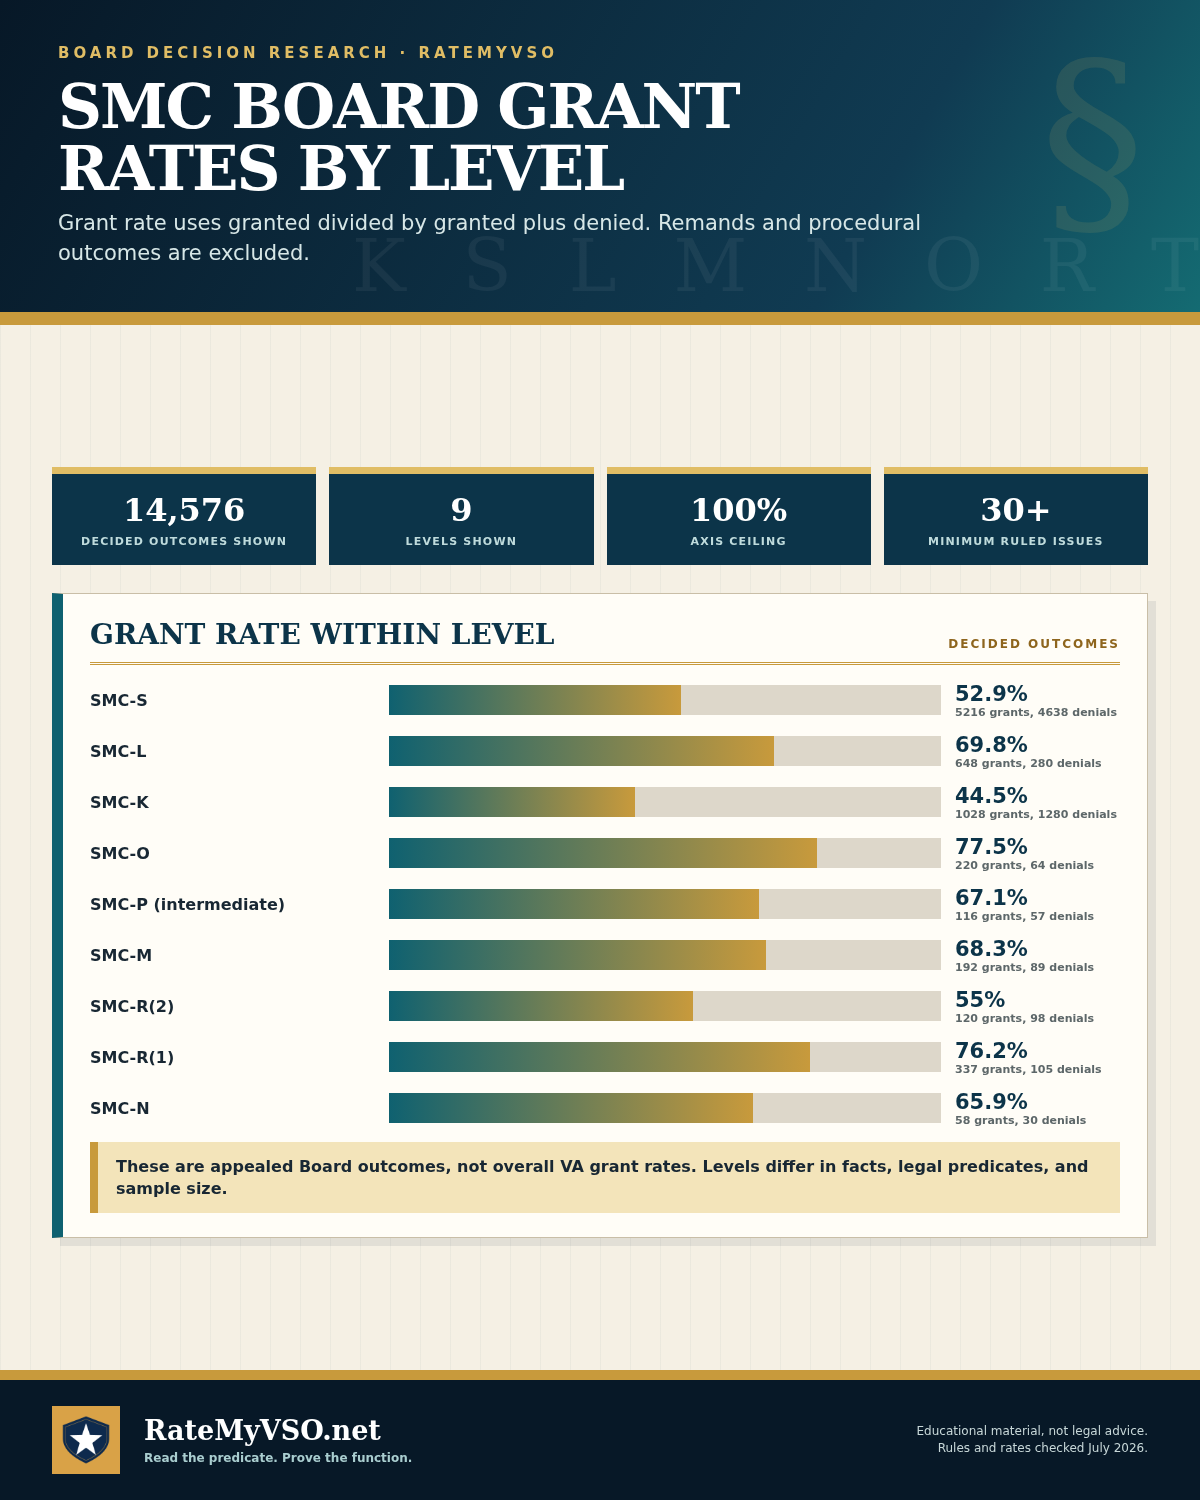
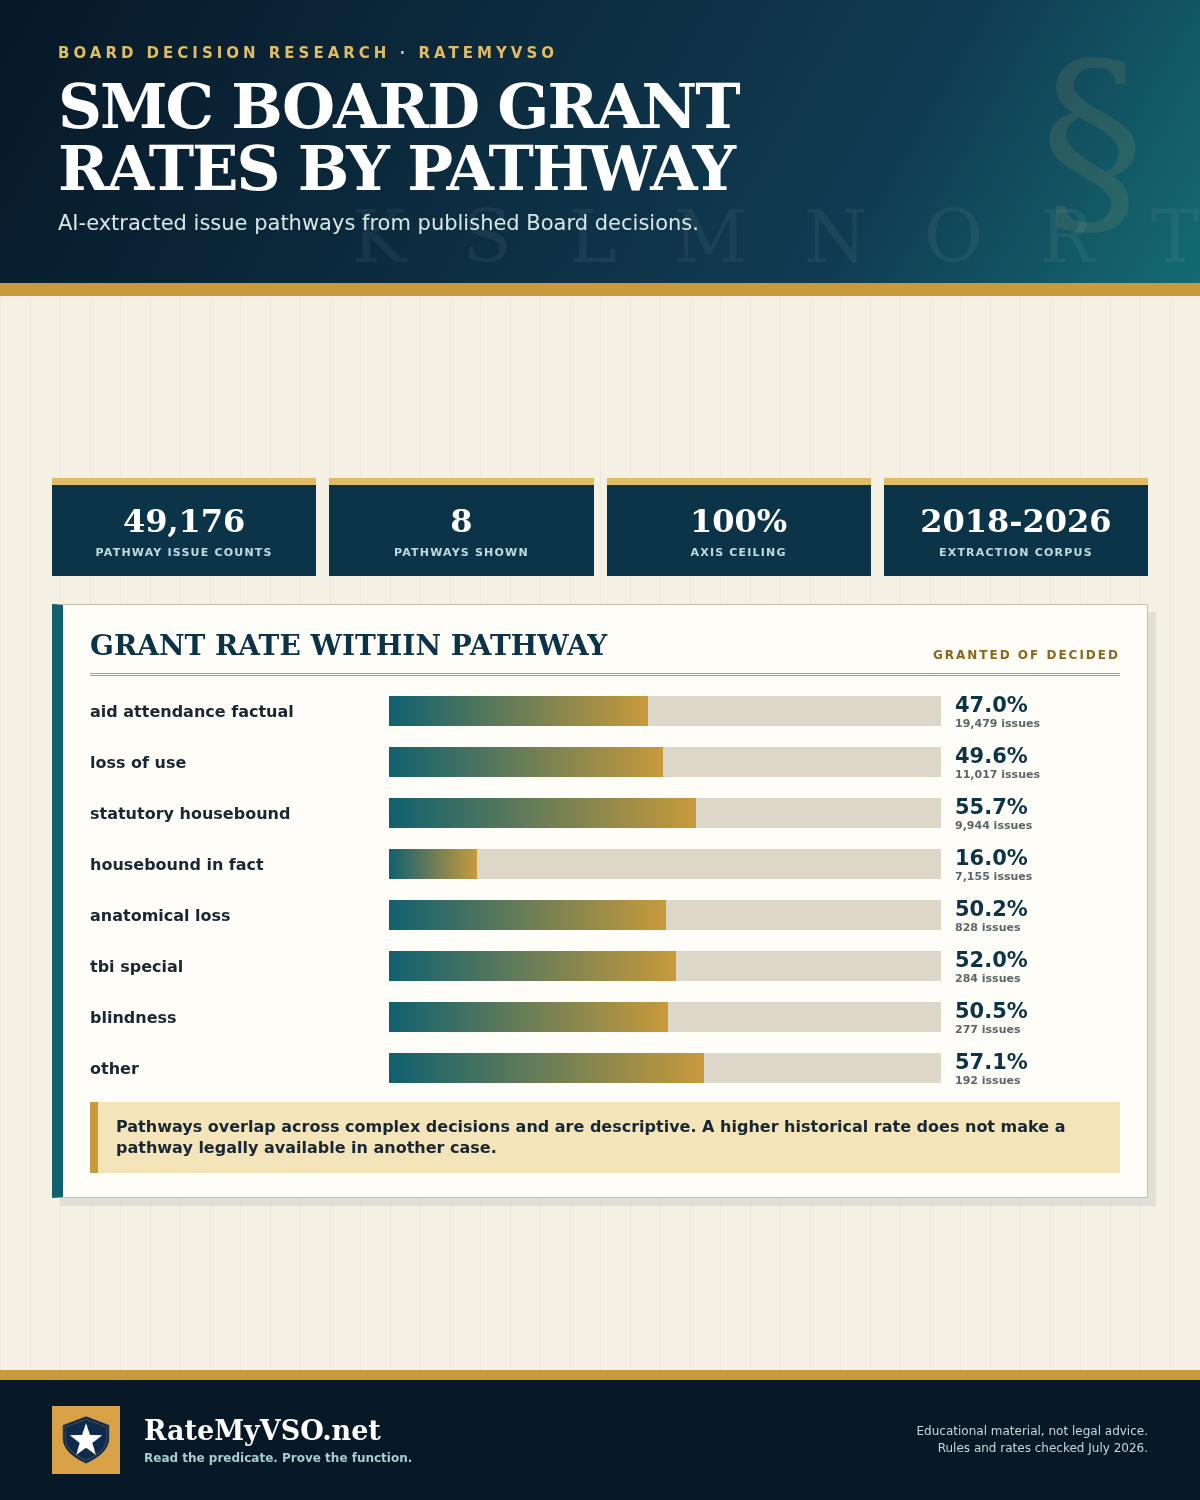
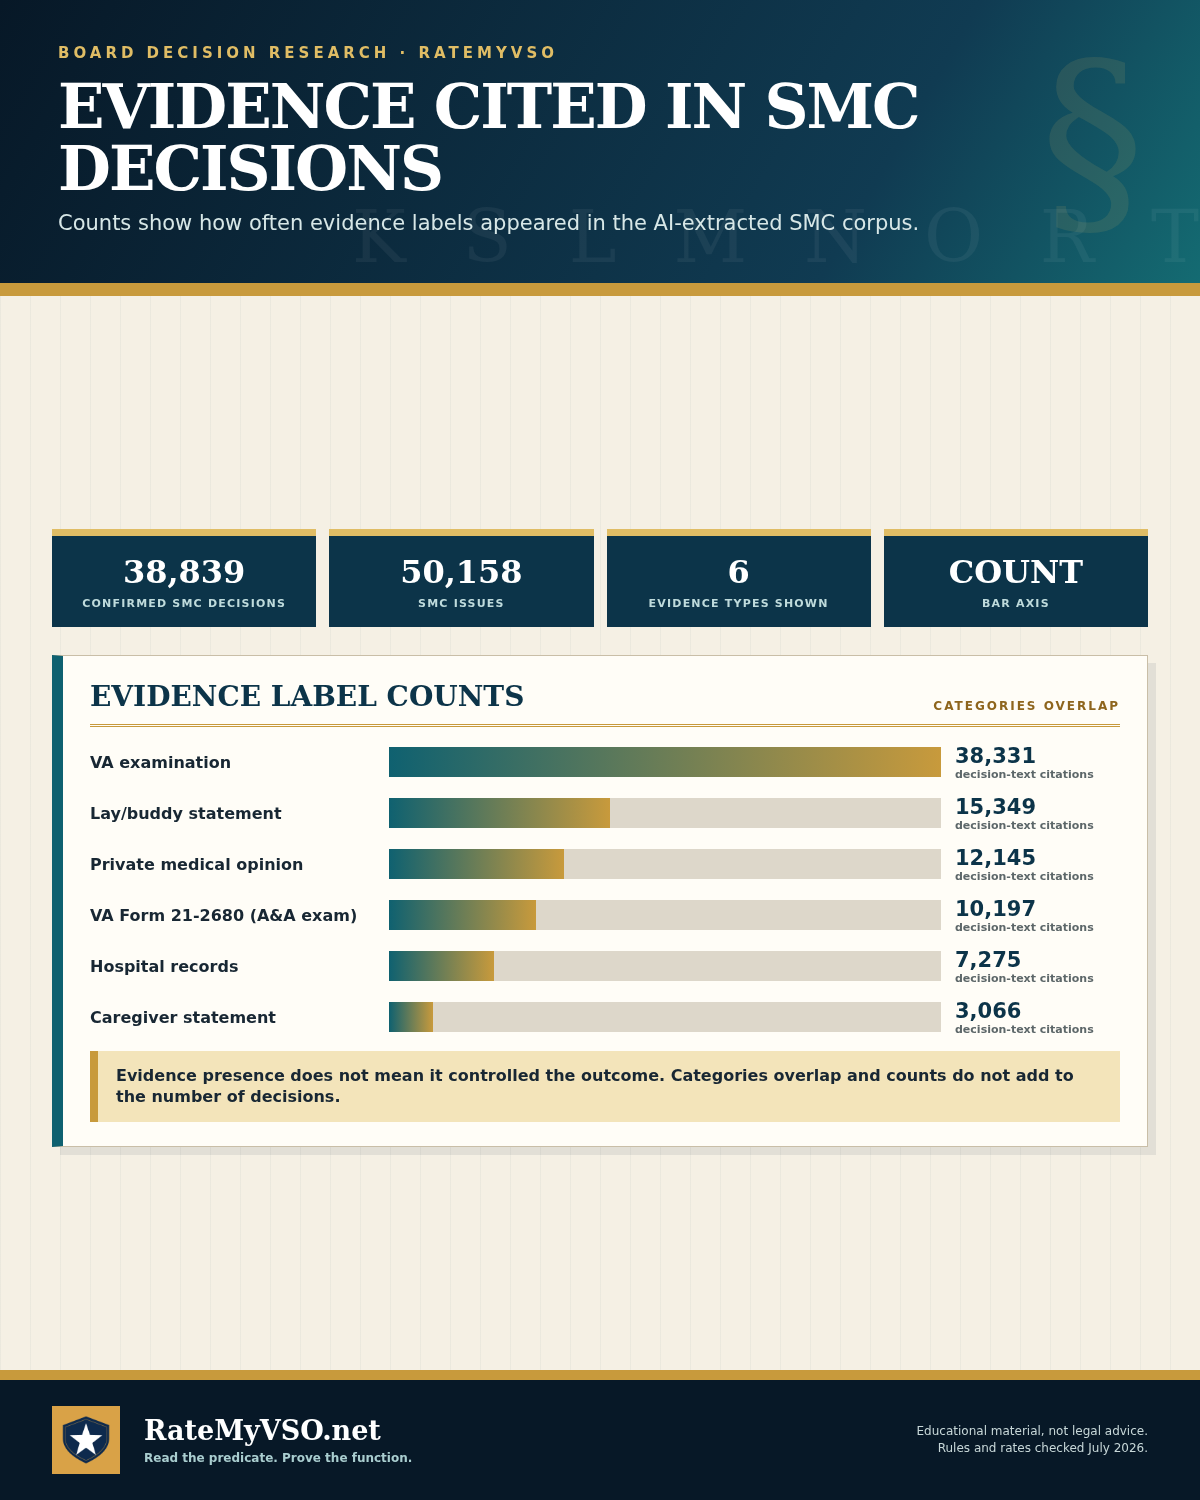
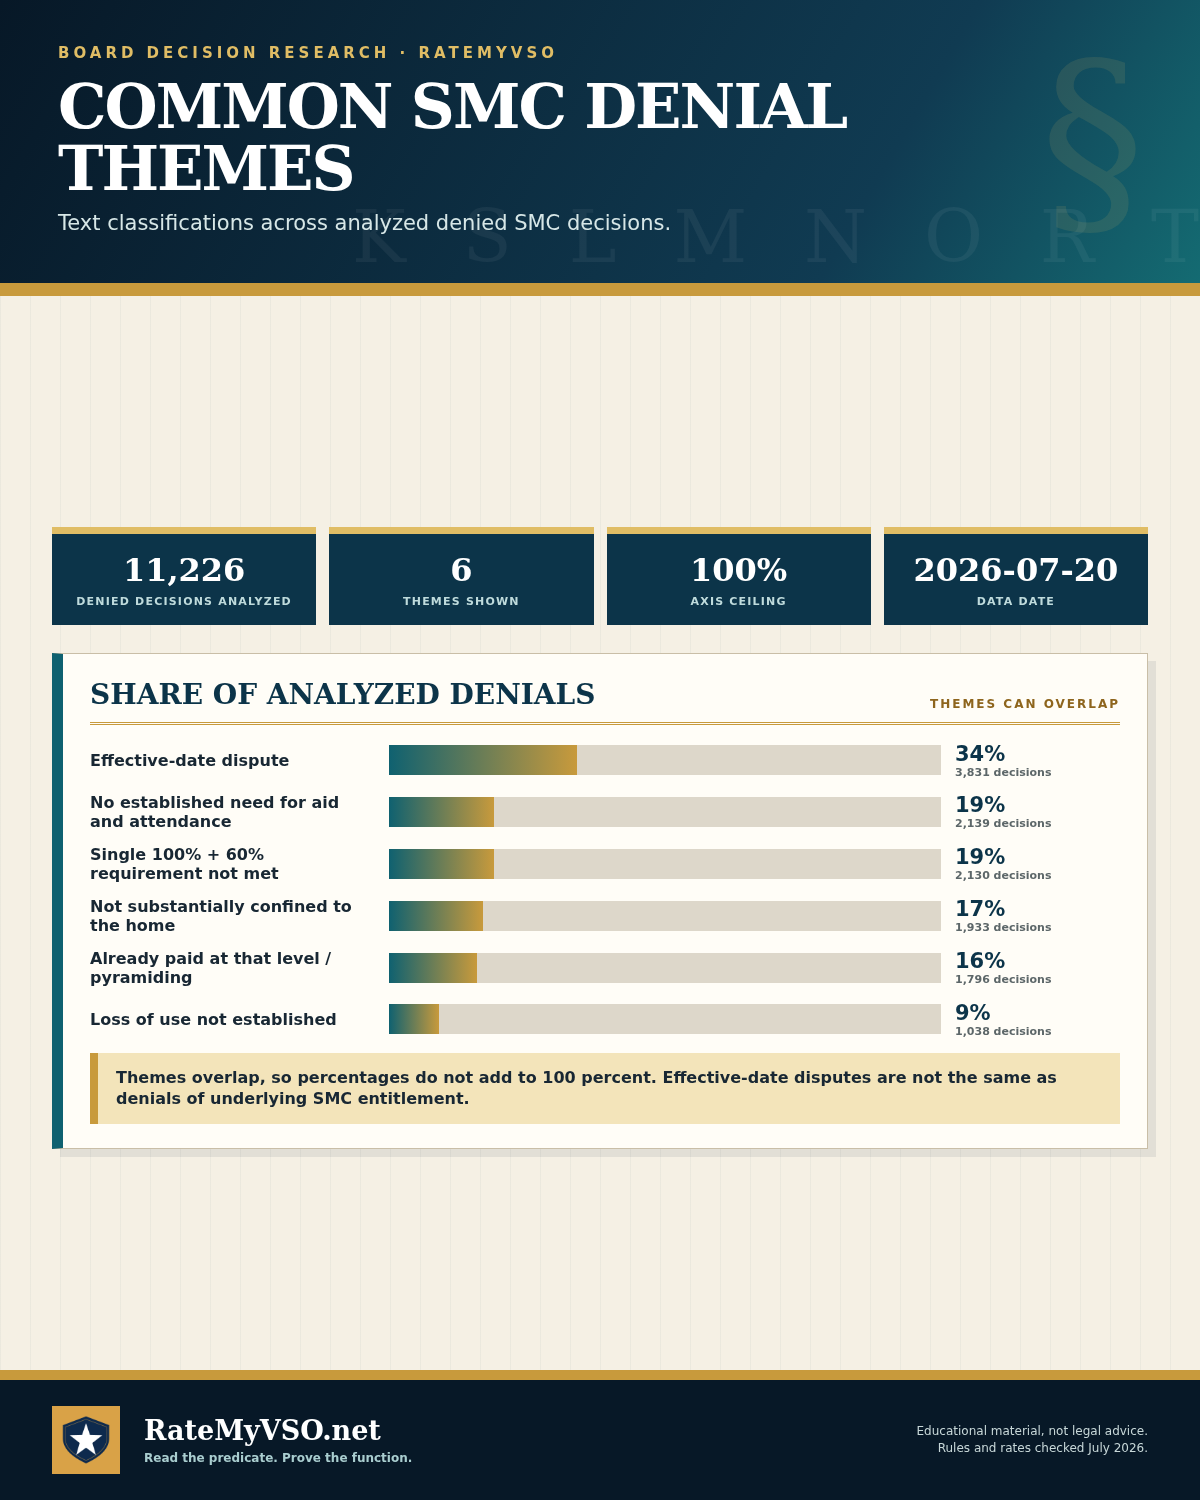
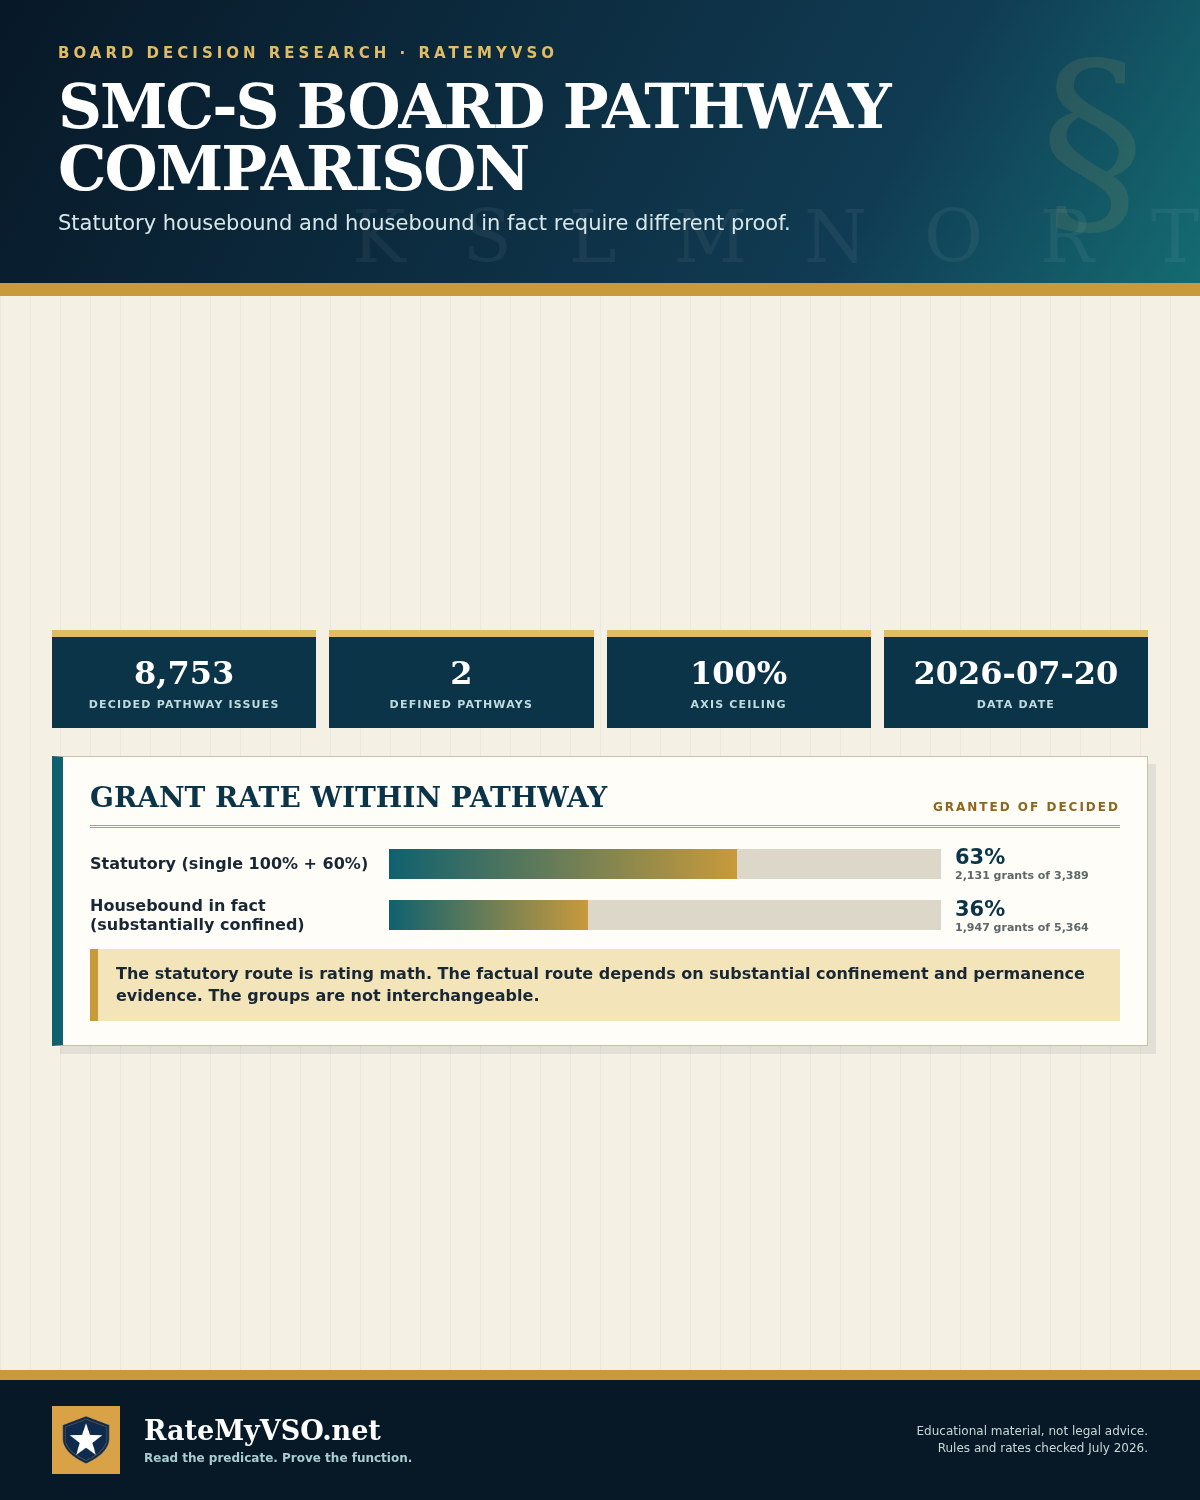
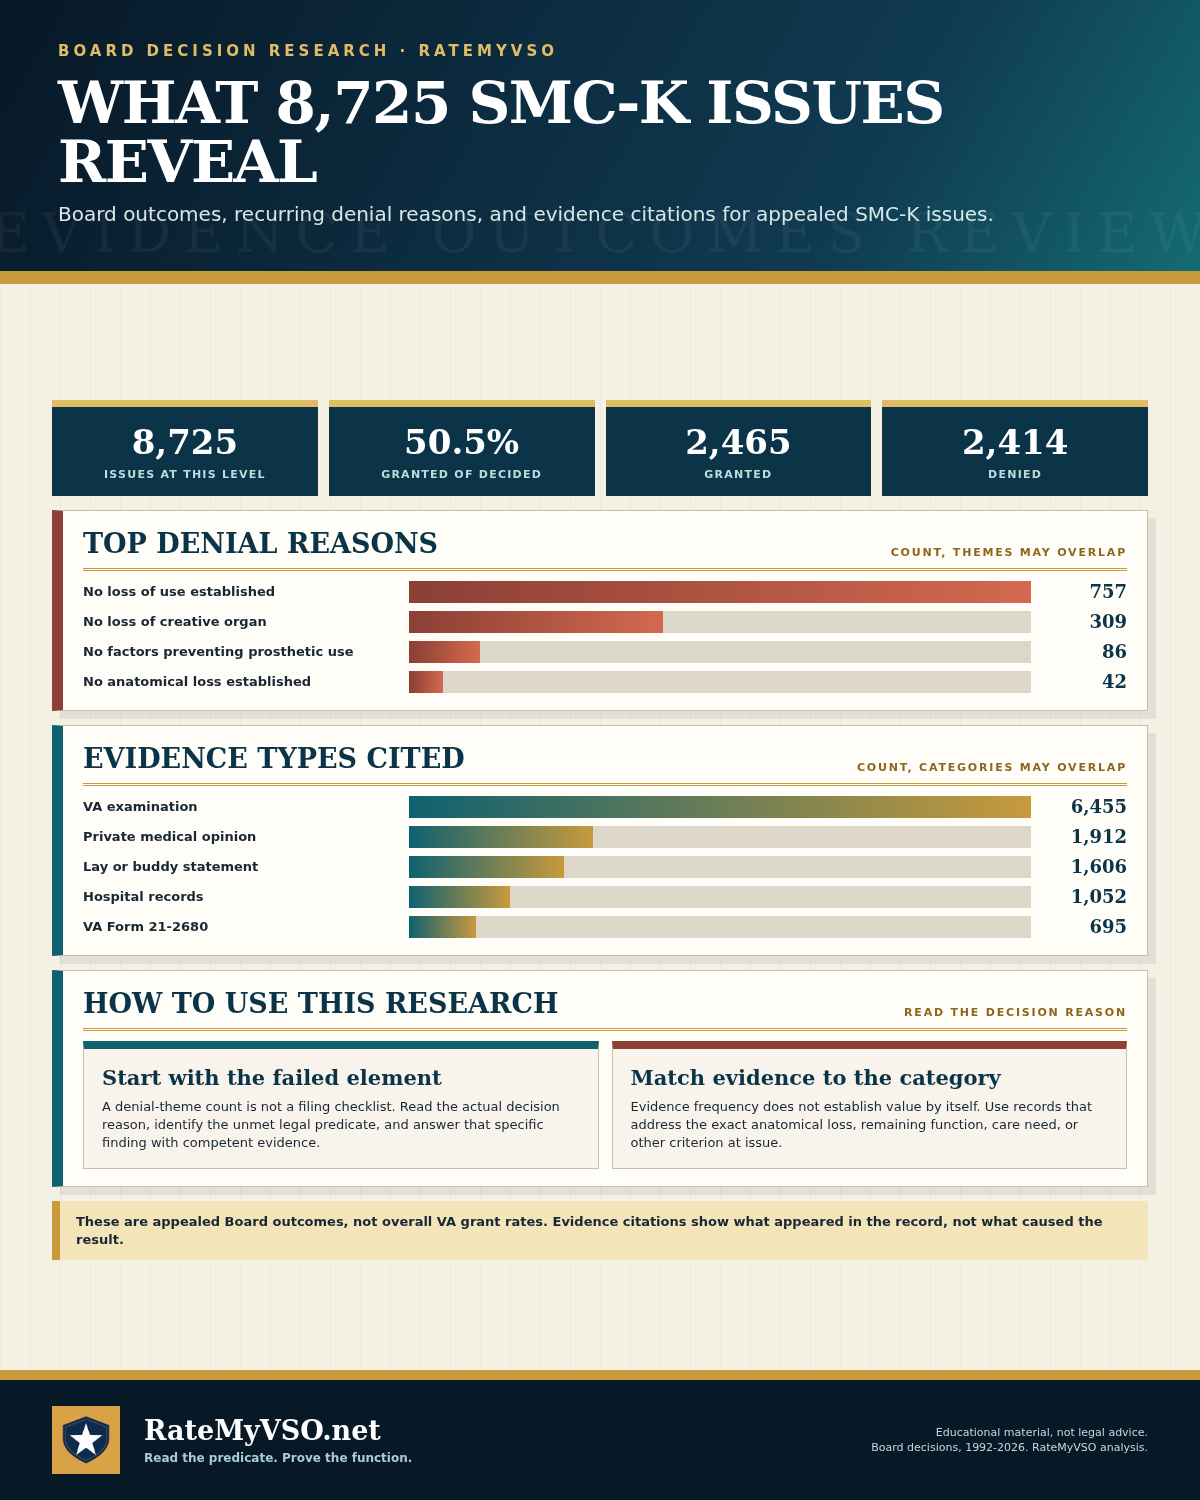
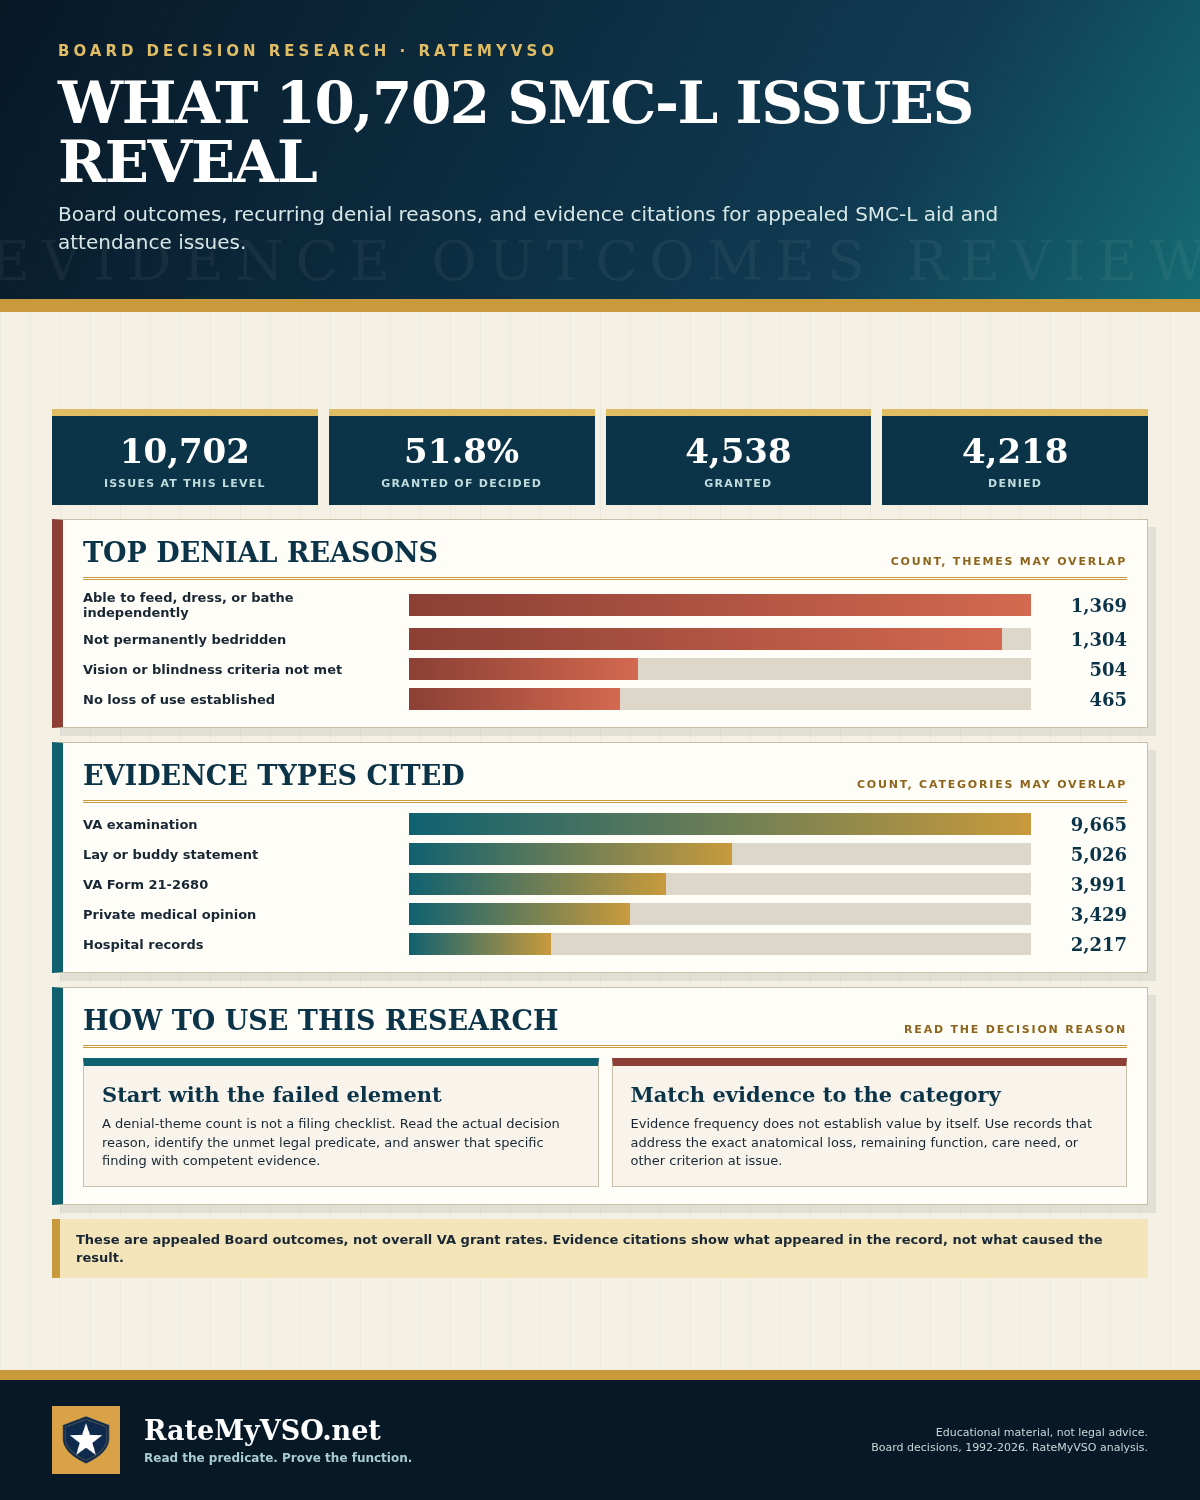
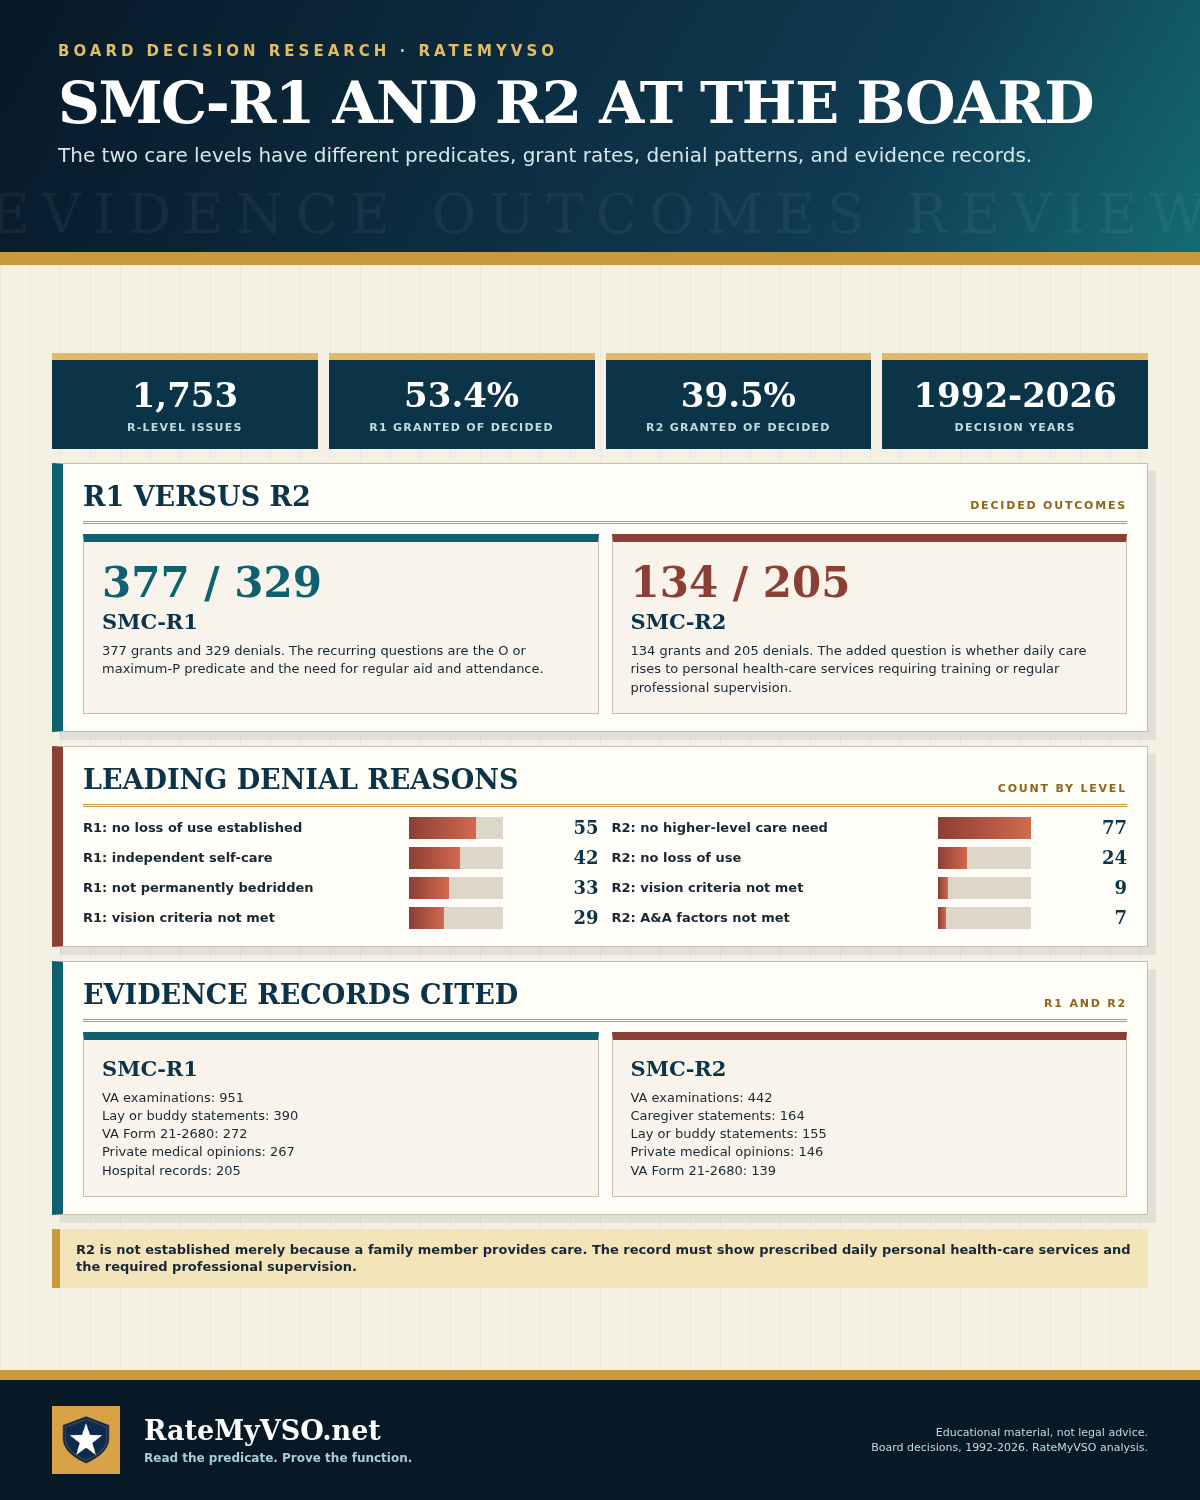
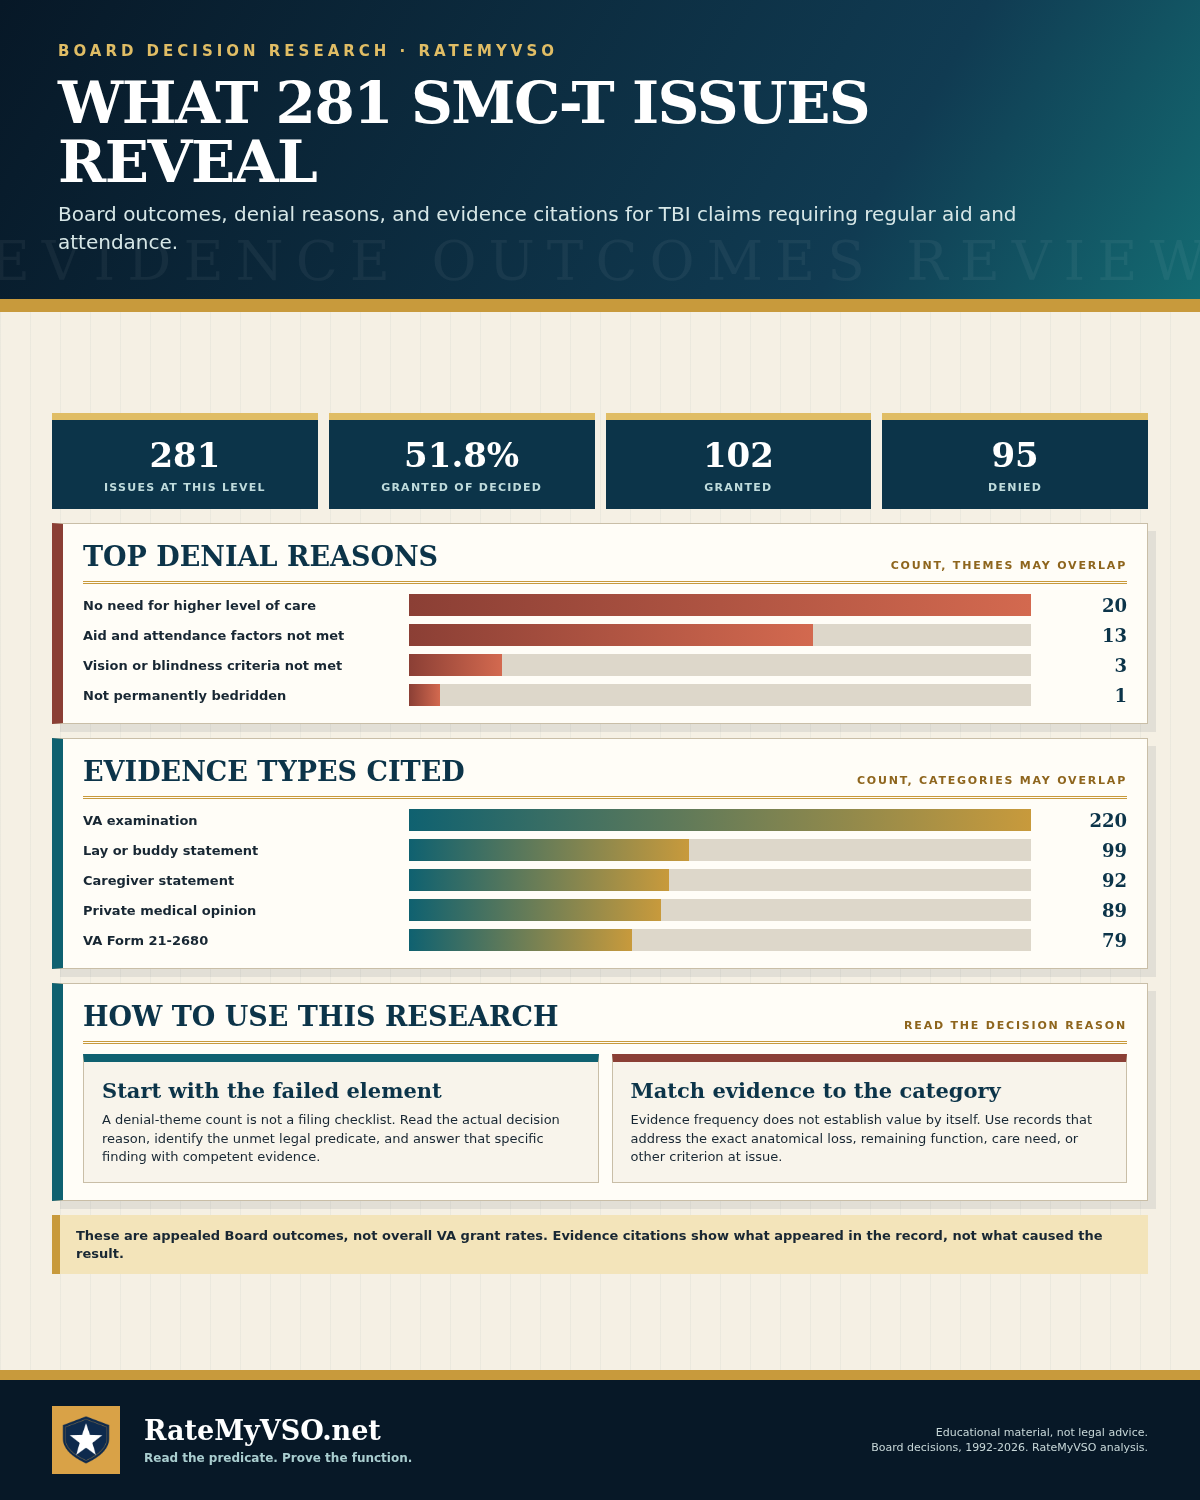
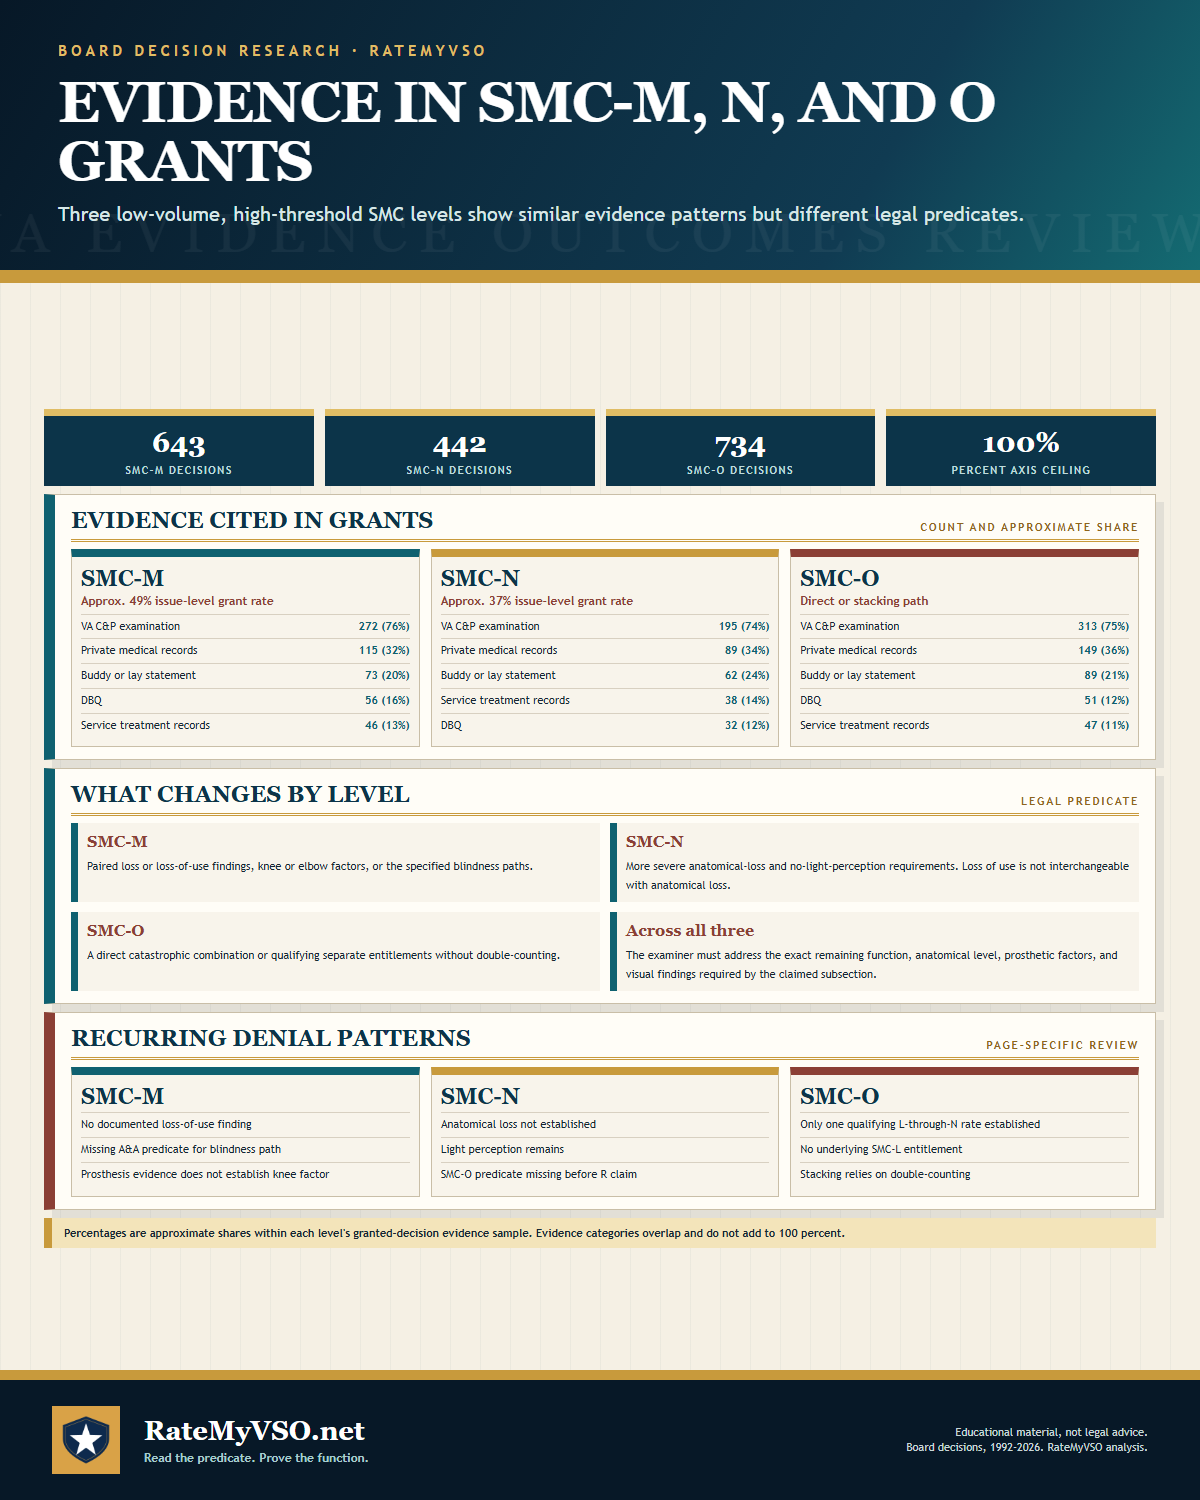
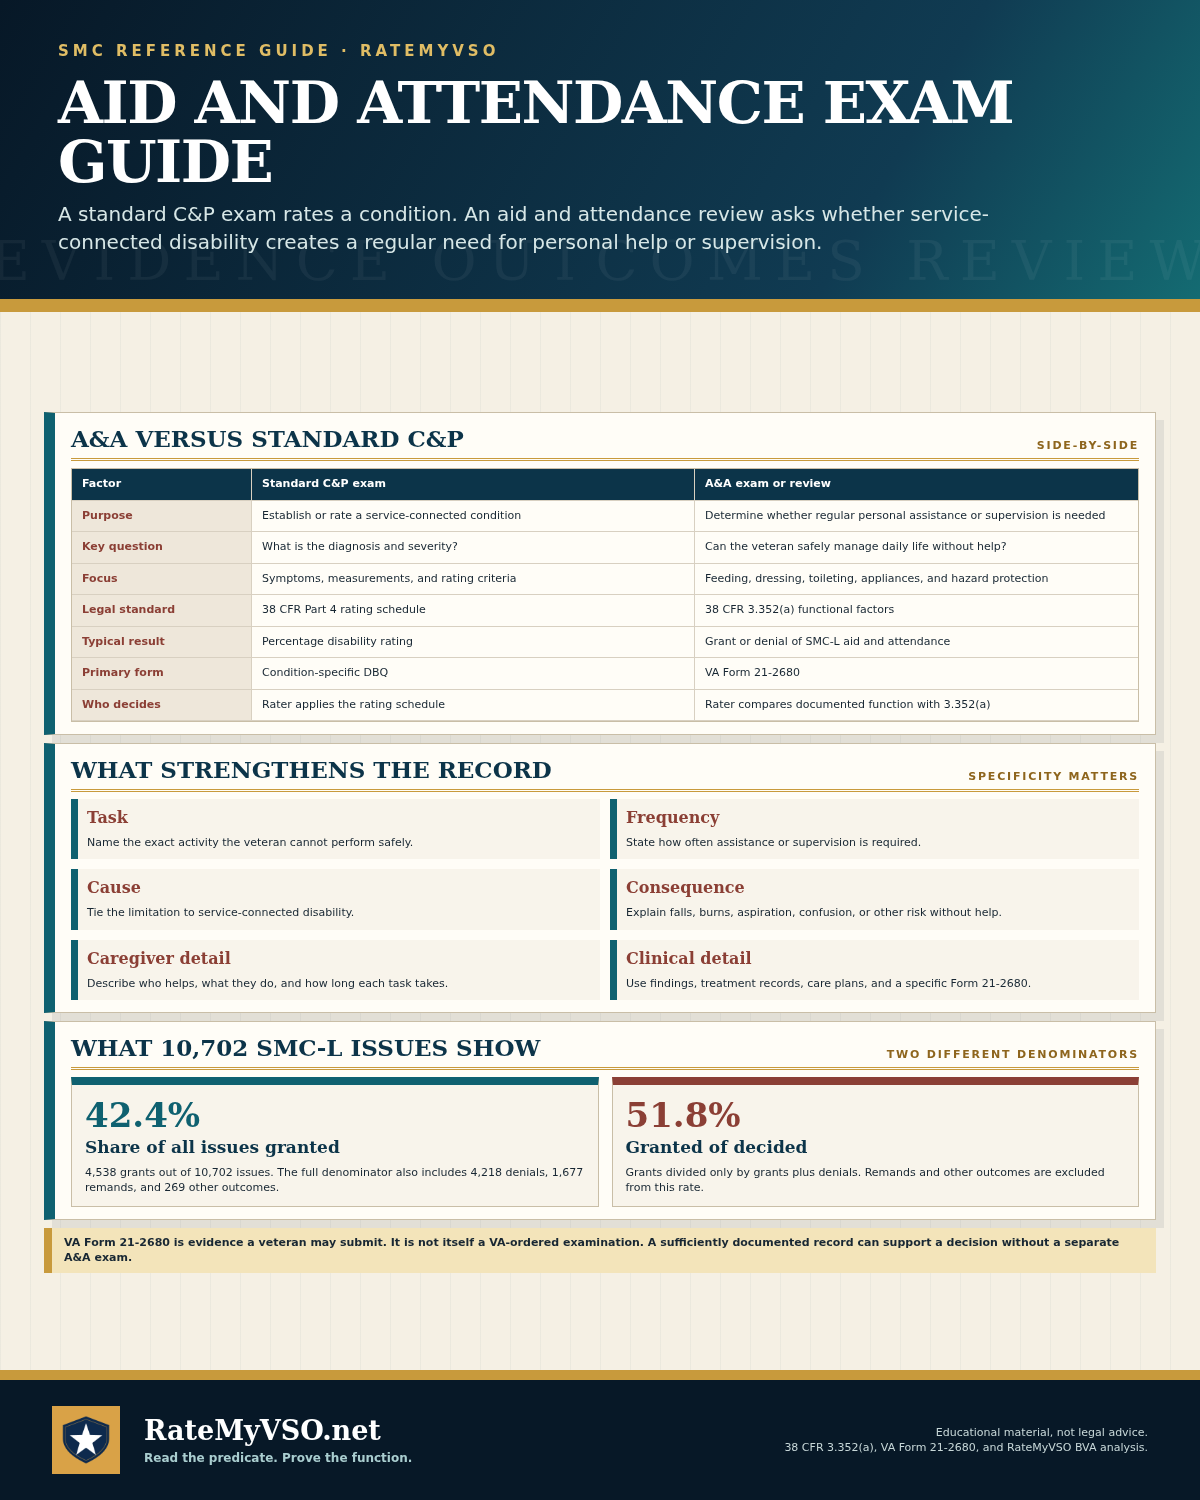
30 printable one-page charts covering Special Monthly Compensation from end to end: what SMC is and how the levels relate to each other, the qualifying losses behind SMC-K and the rules on when a K award can be added, housebound compensation and how it differs from the aid-and-attendance levels, the SMC-L through O combinations, the intermediate rates, the two higher-level aid-and-attendance tiers and the predicates they require, the separate TBI route, the evidence each level actually turns on including VA Form 21-2680, the 2026 rate ladder, the appeal and effective-date questions, and research on the outcomes recorded in published Board decisions.
All 30 visual guides
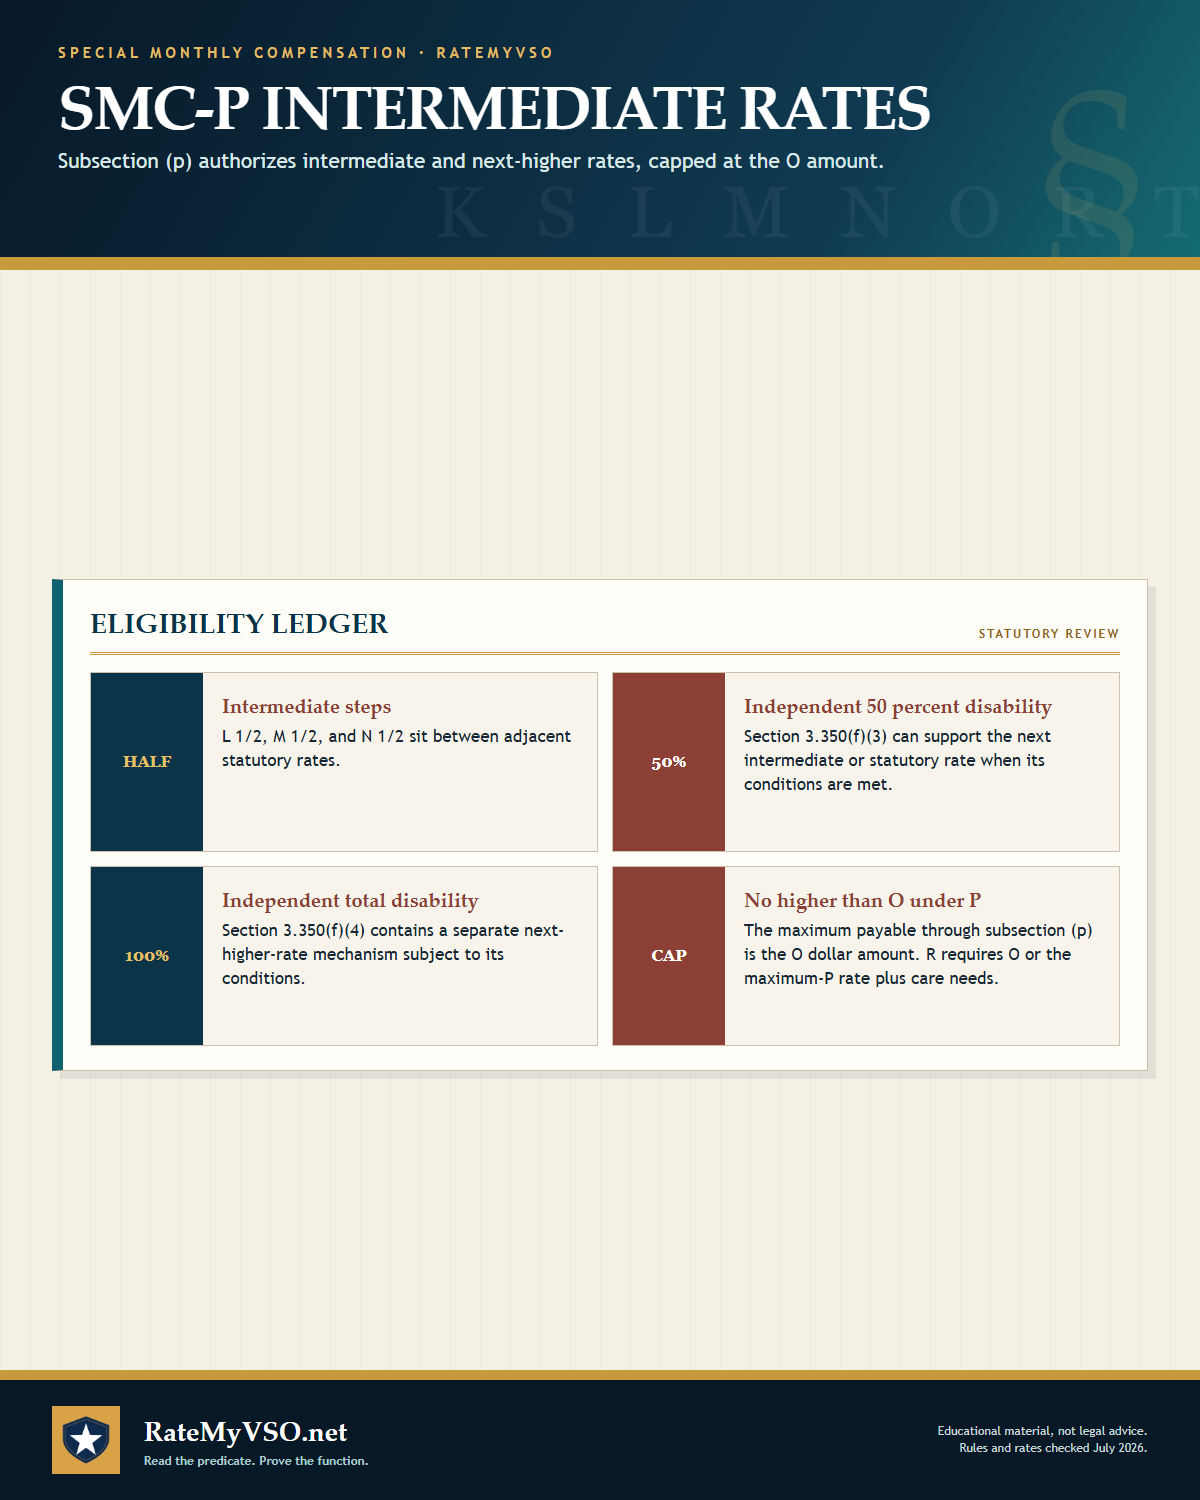
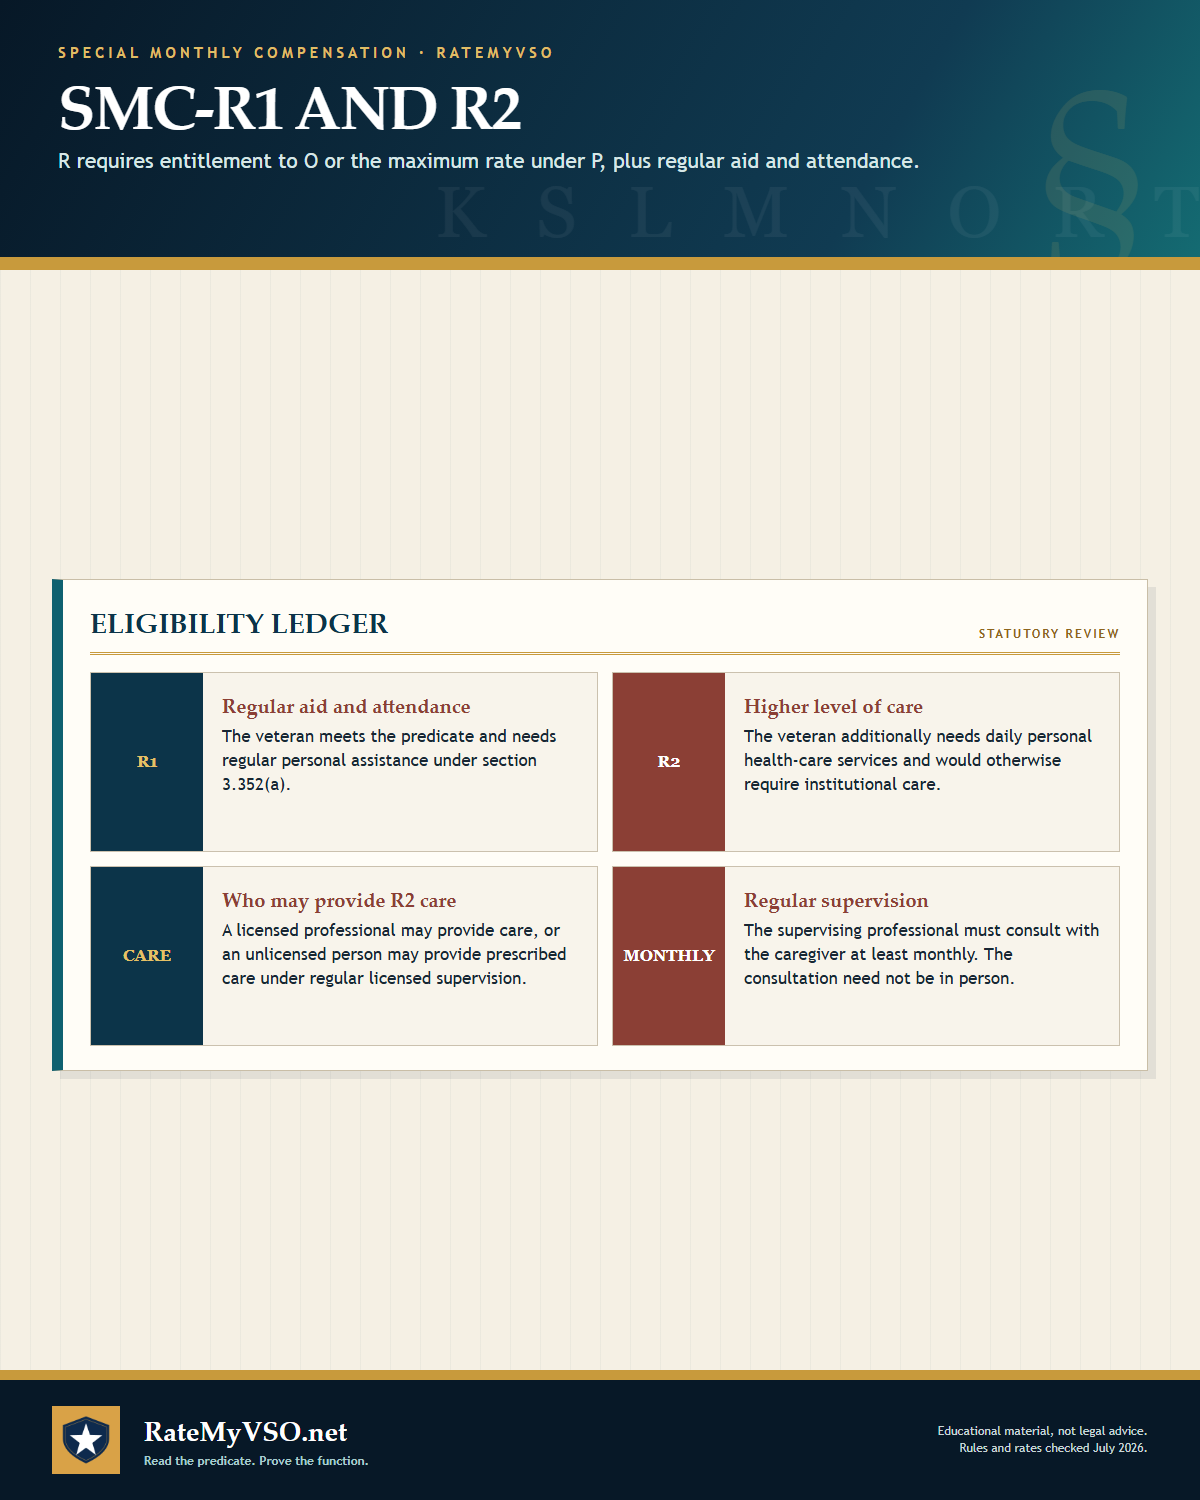
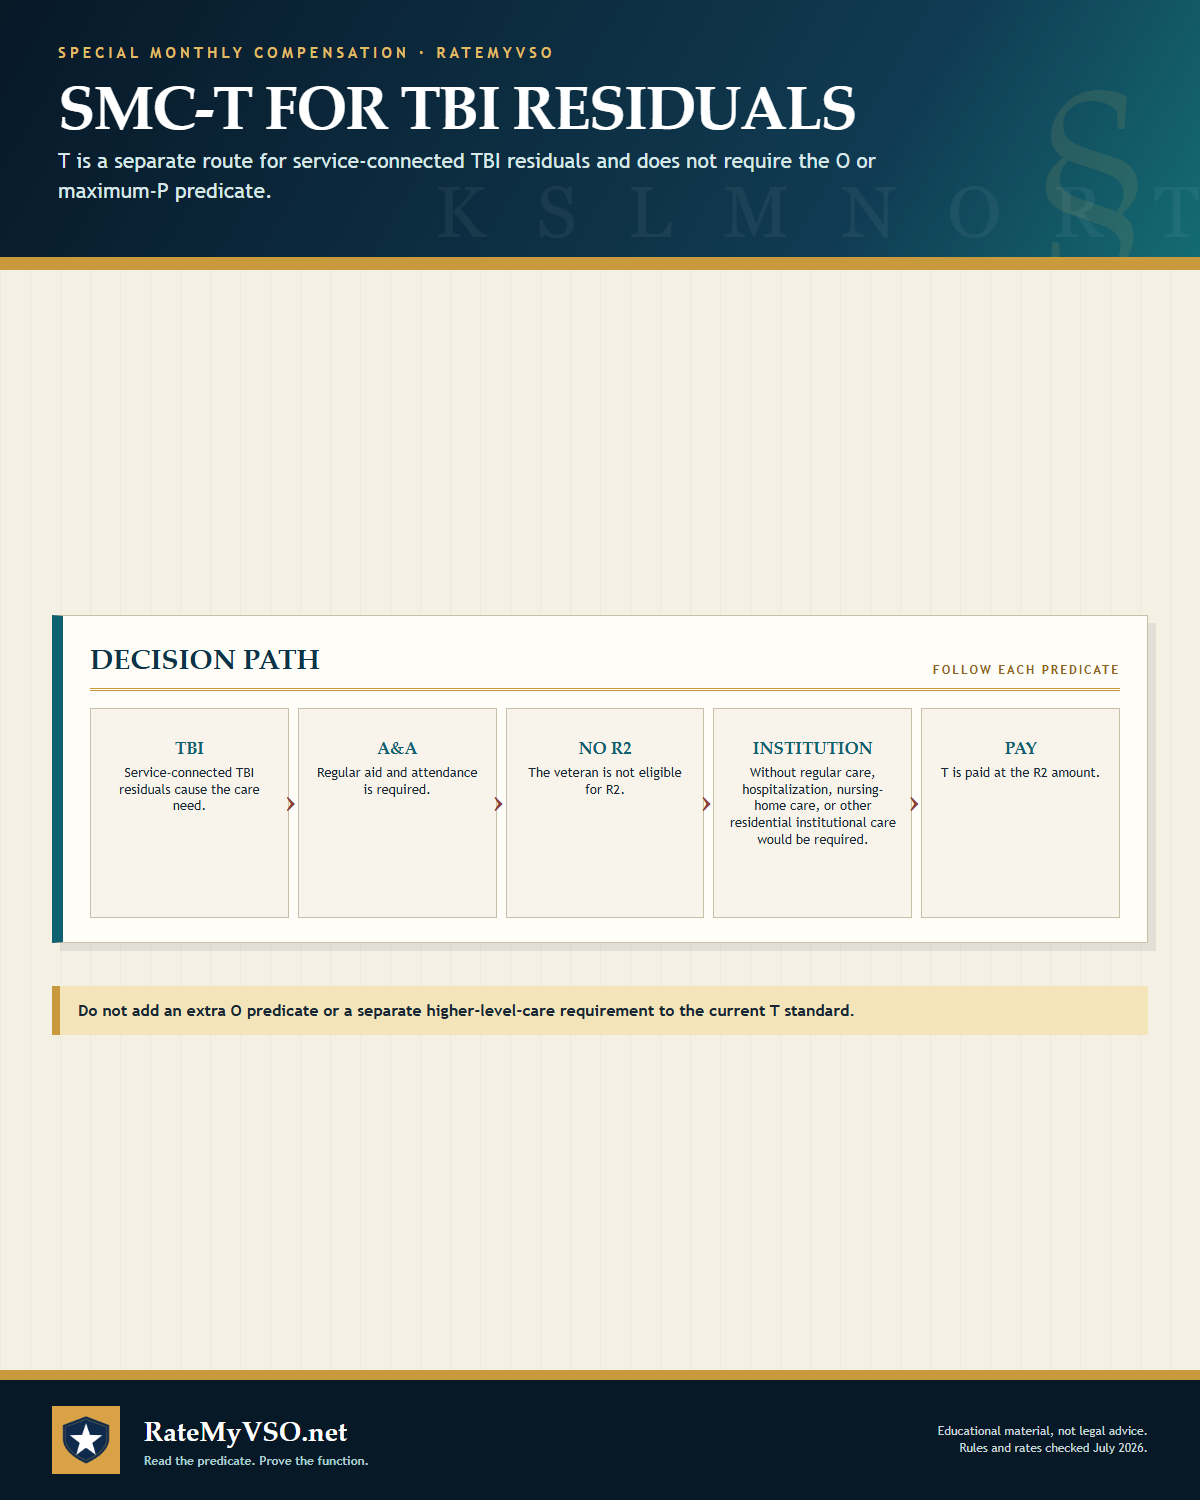
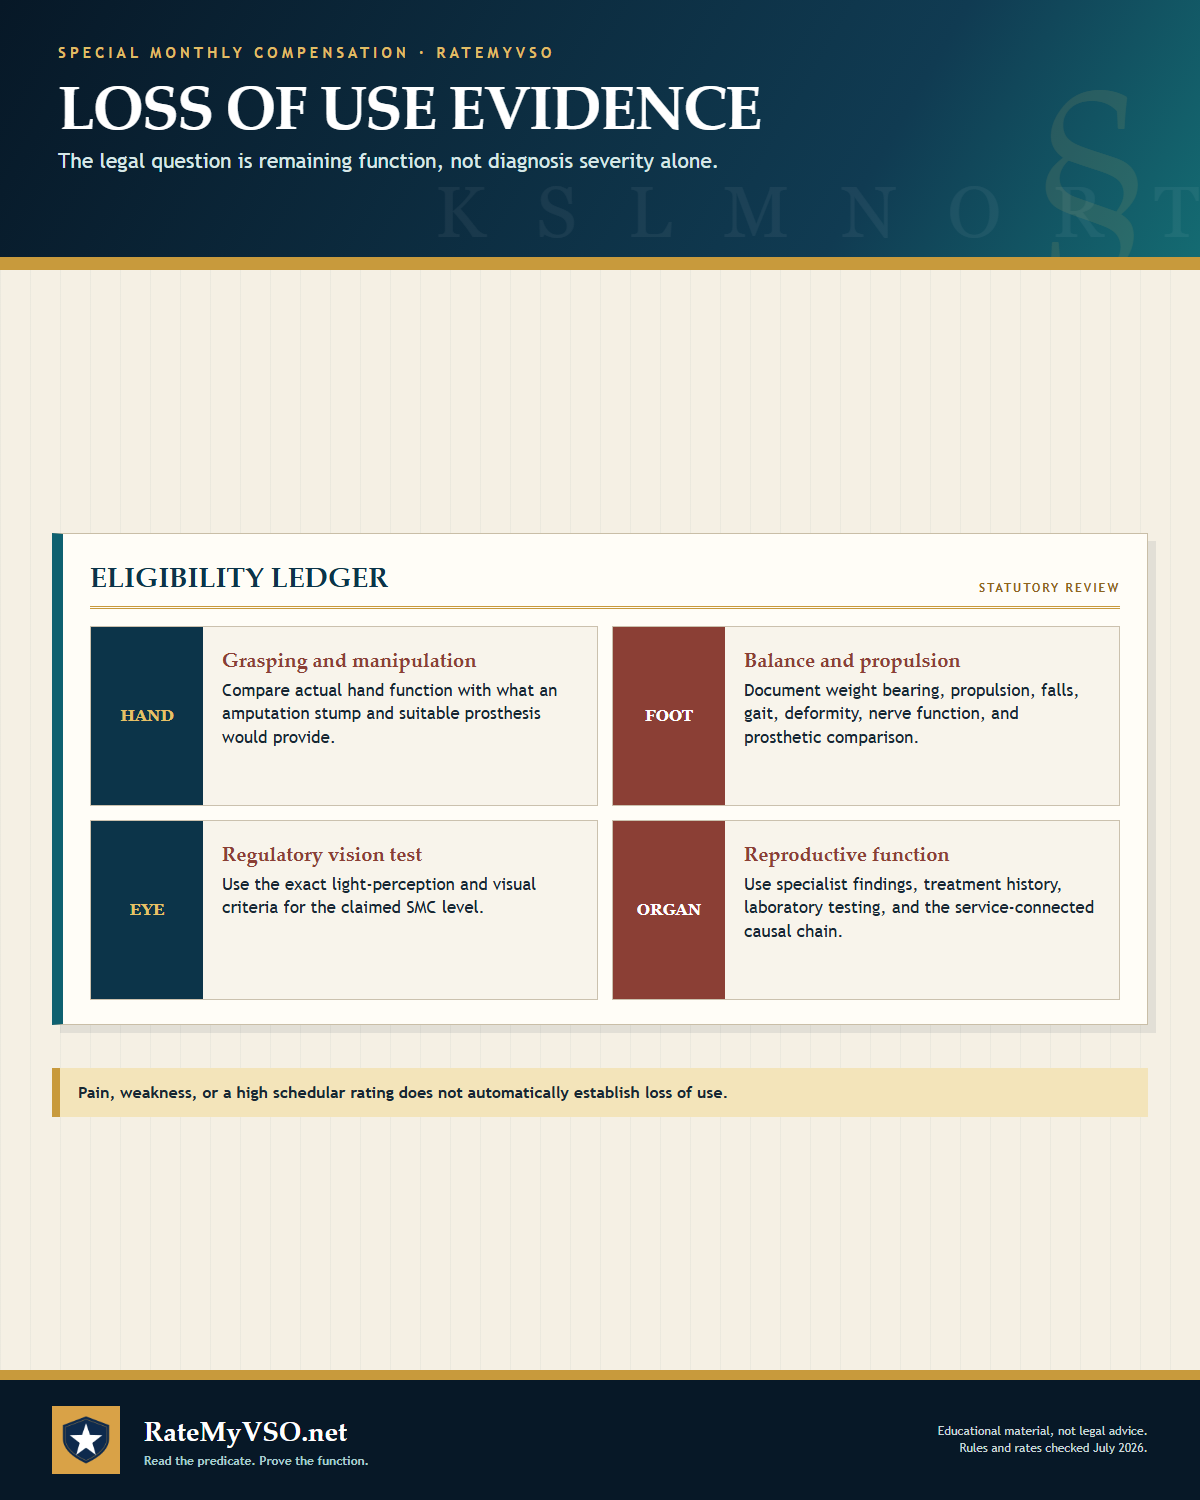
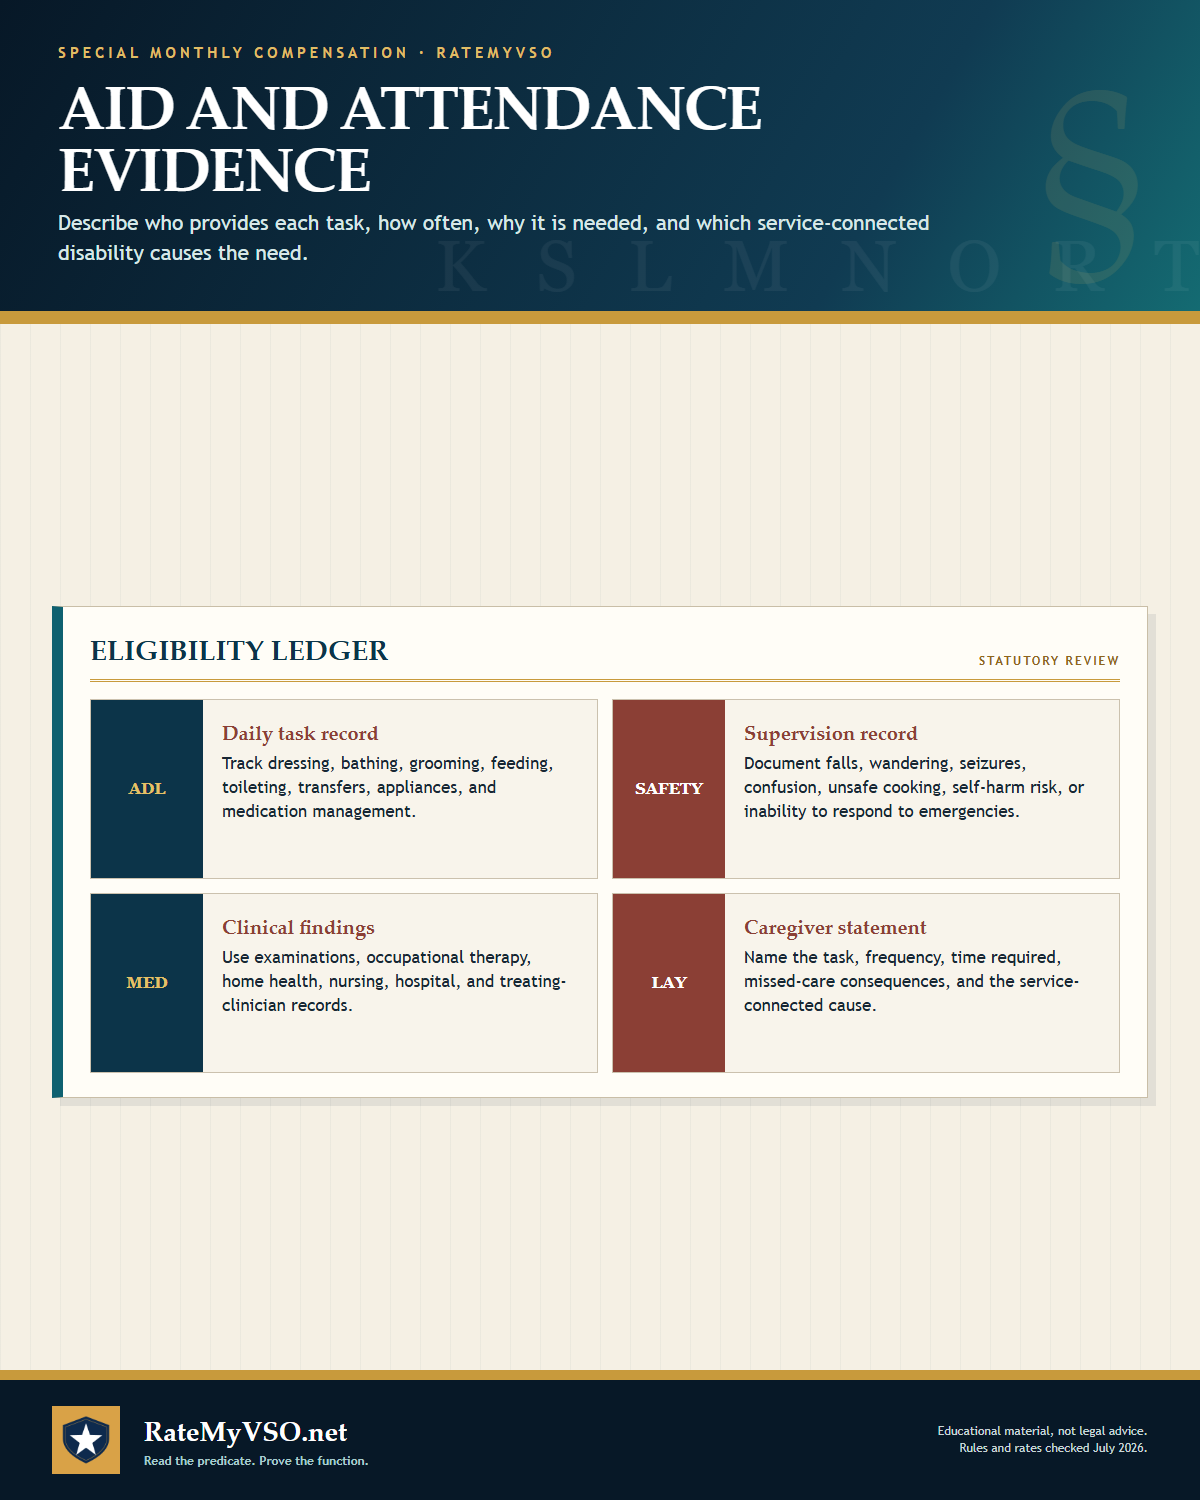
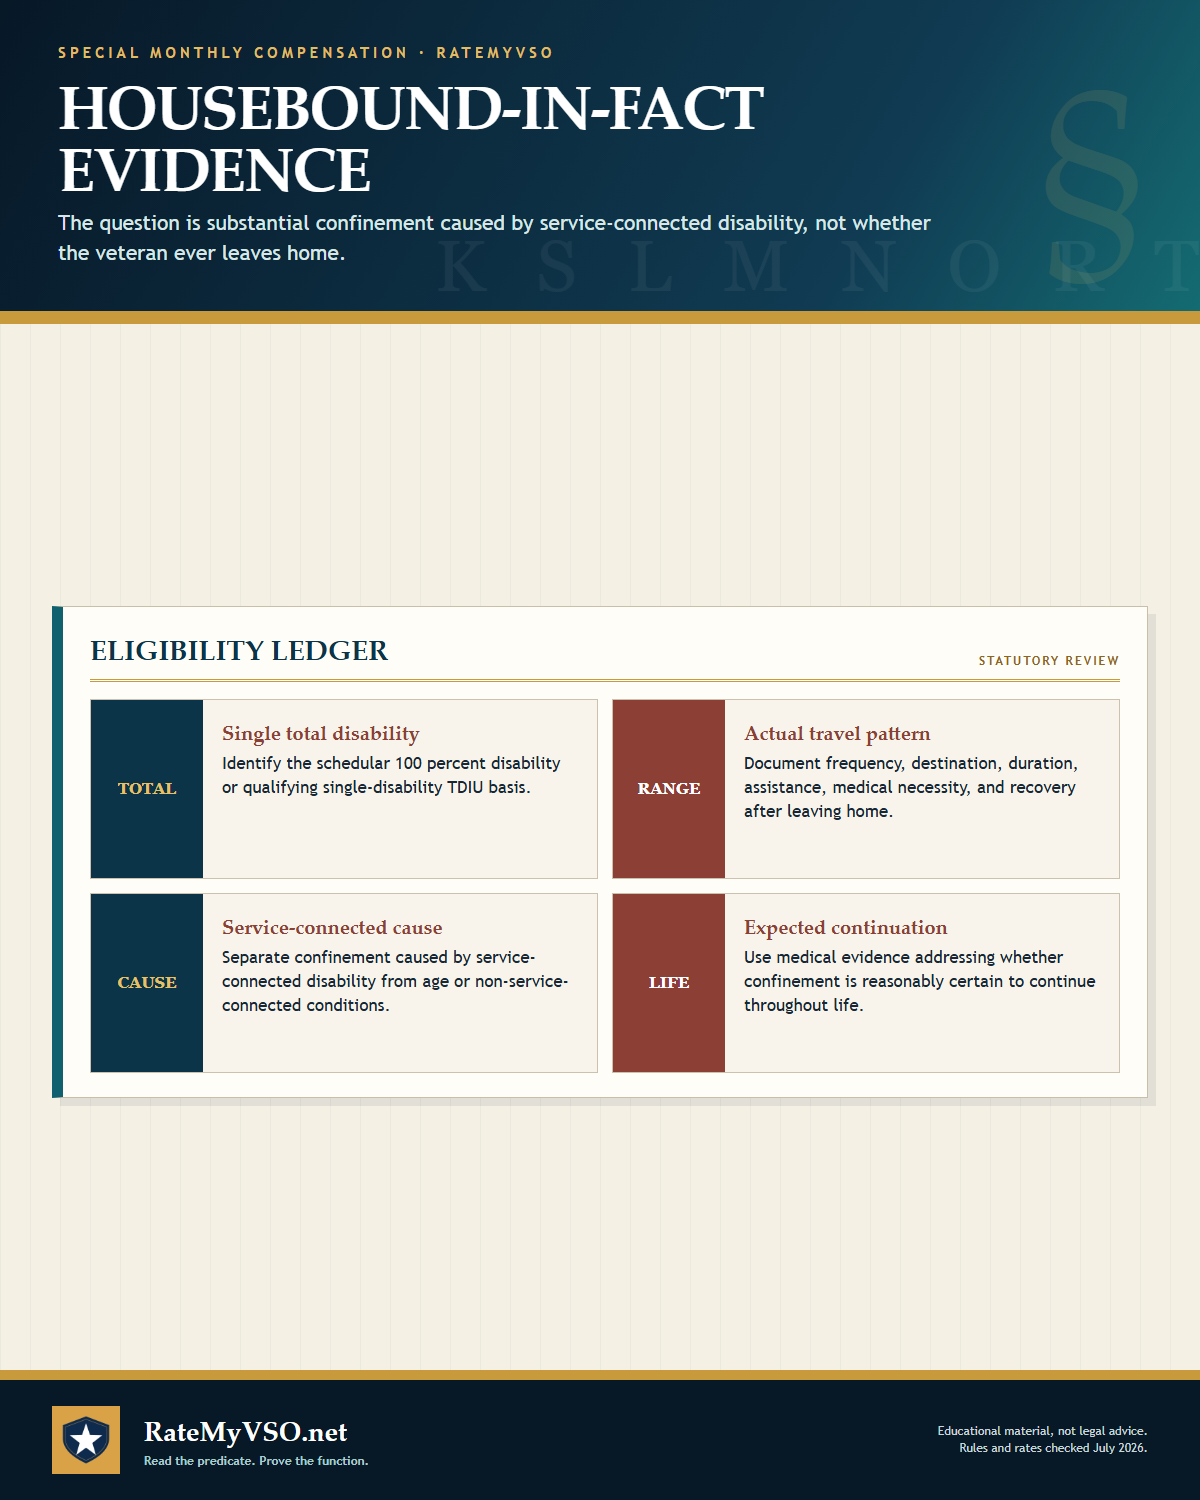
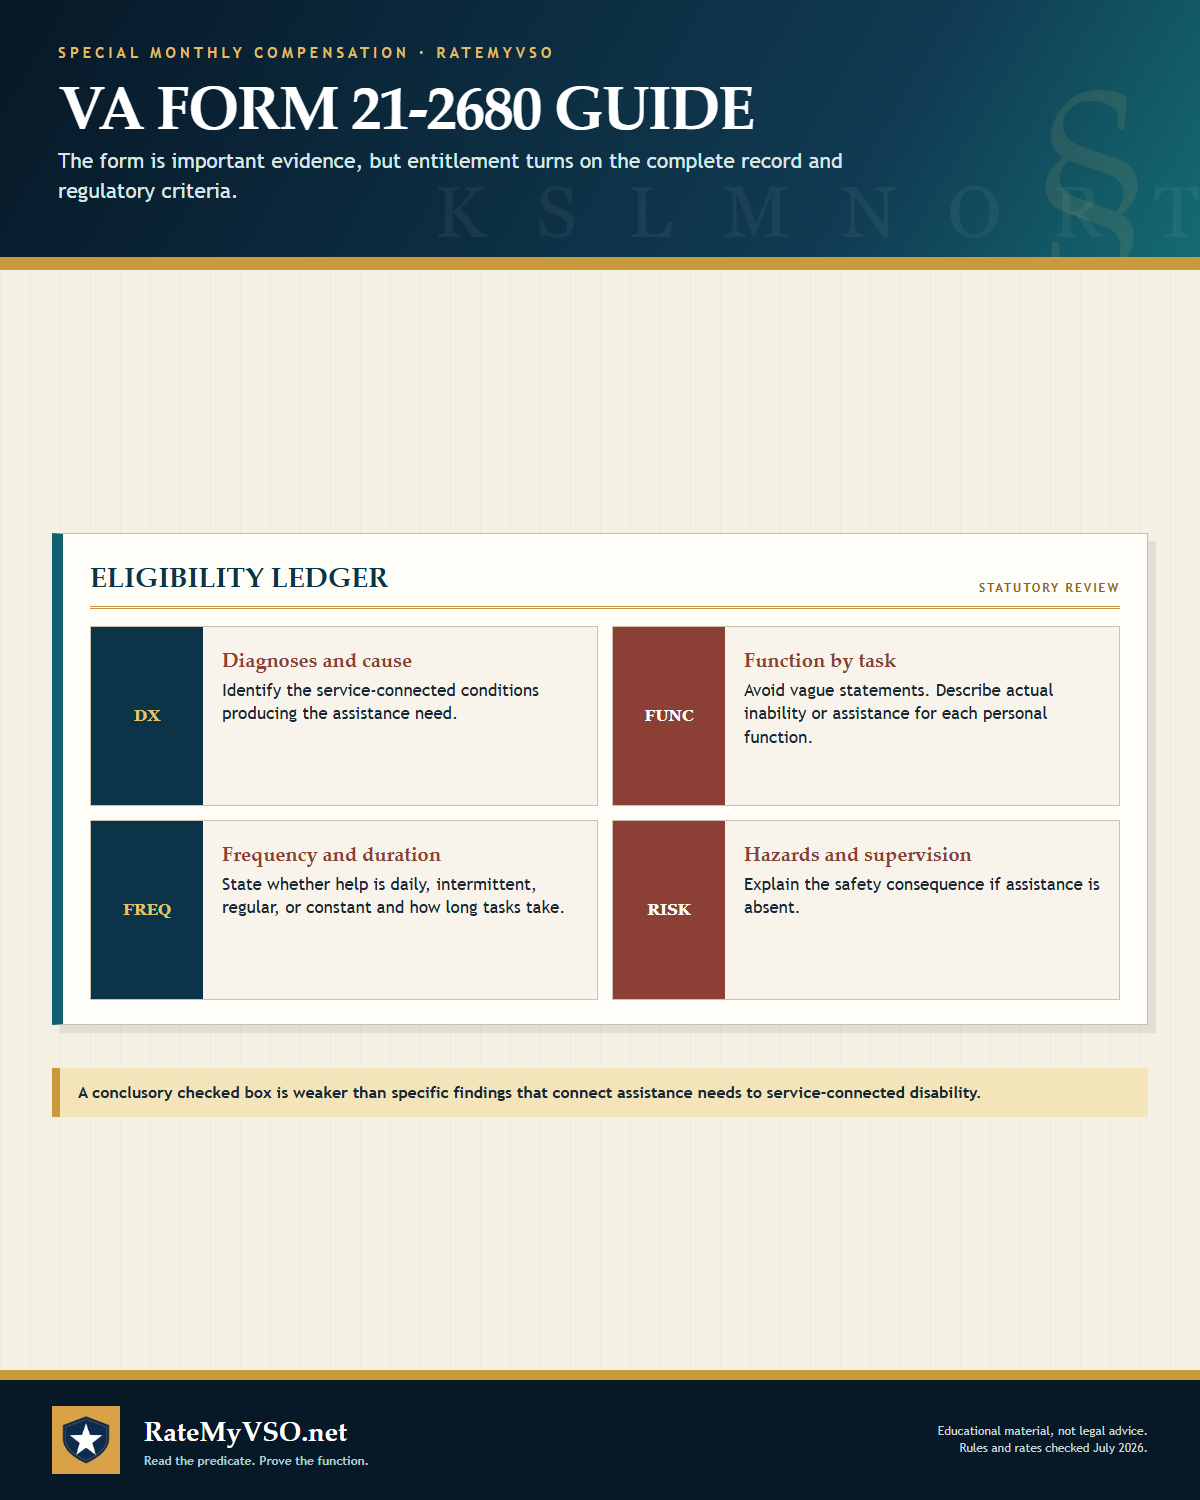
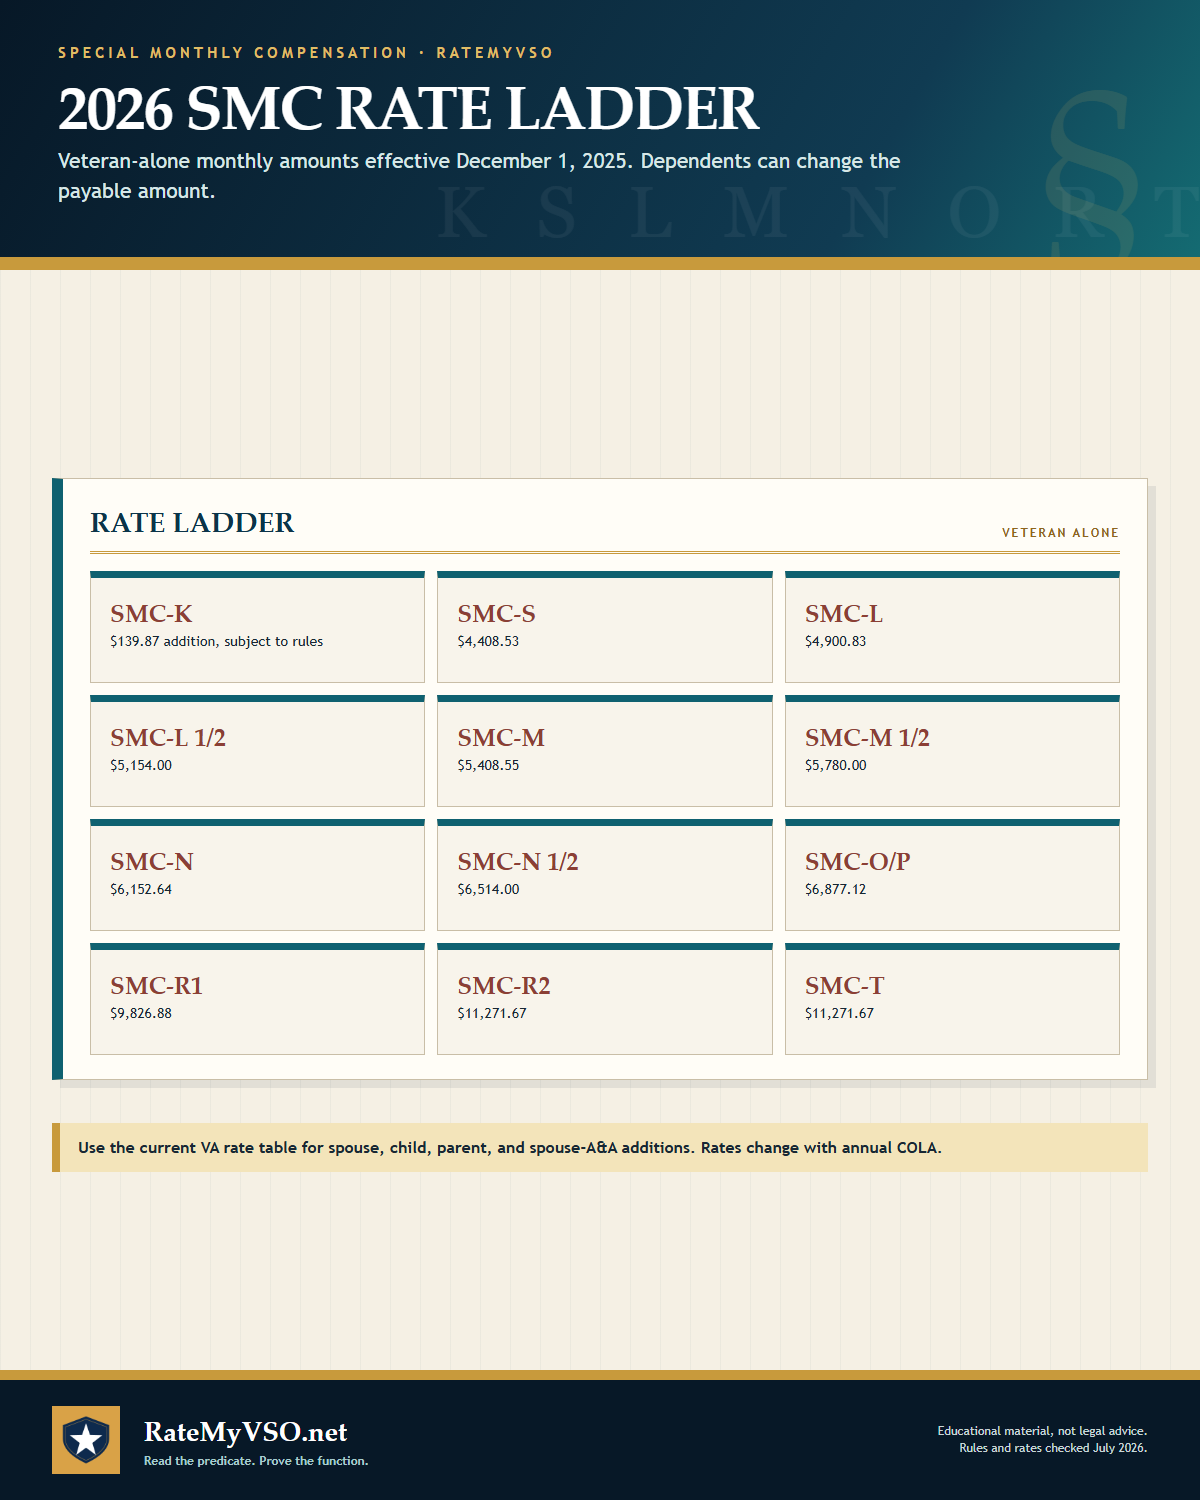
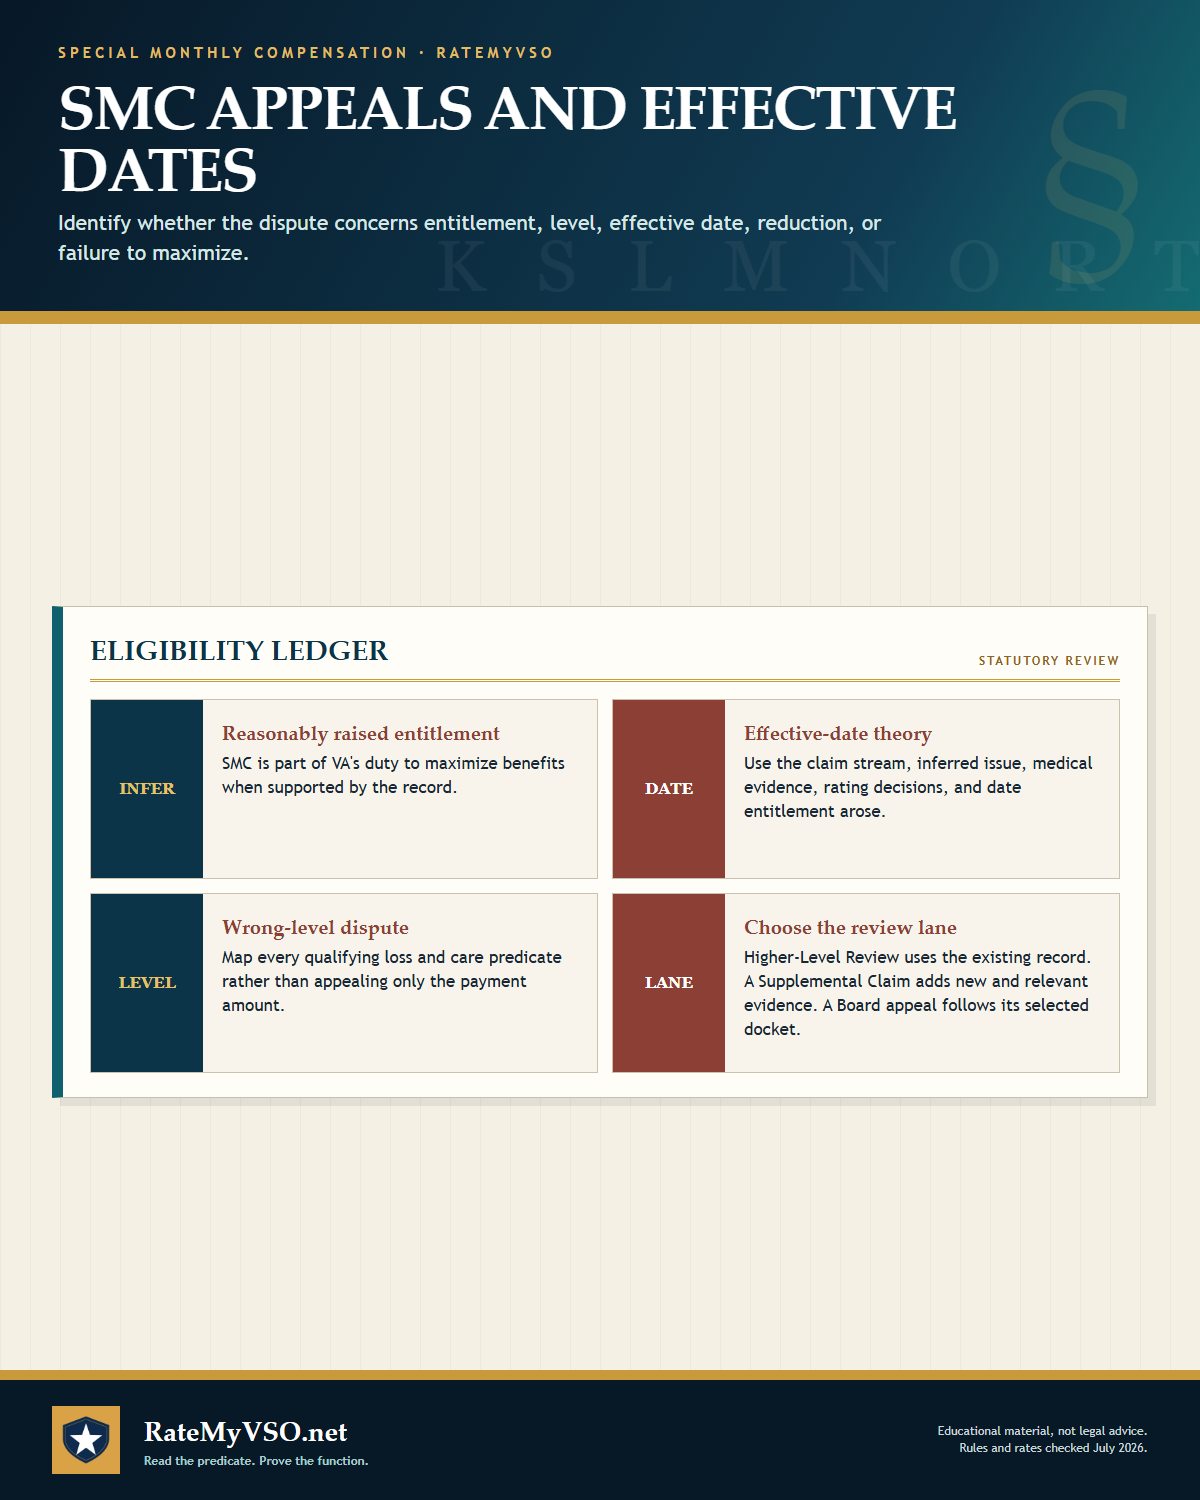
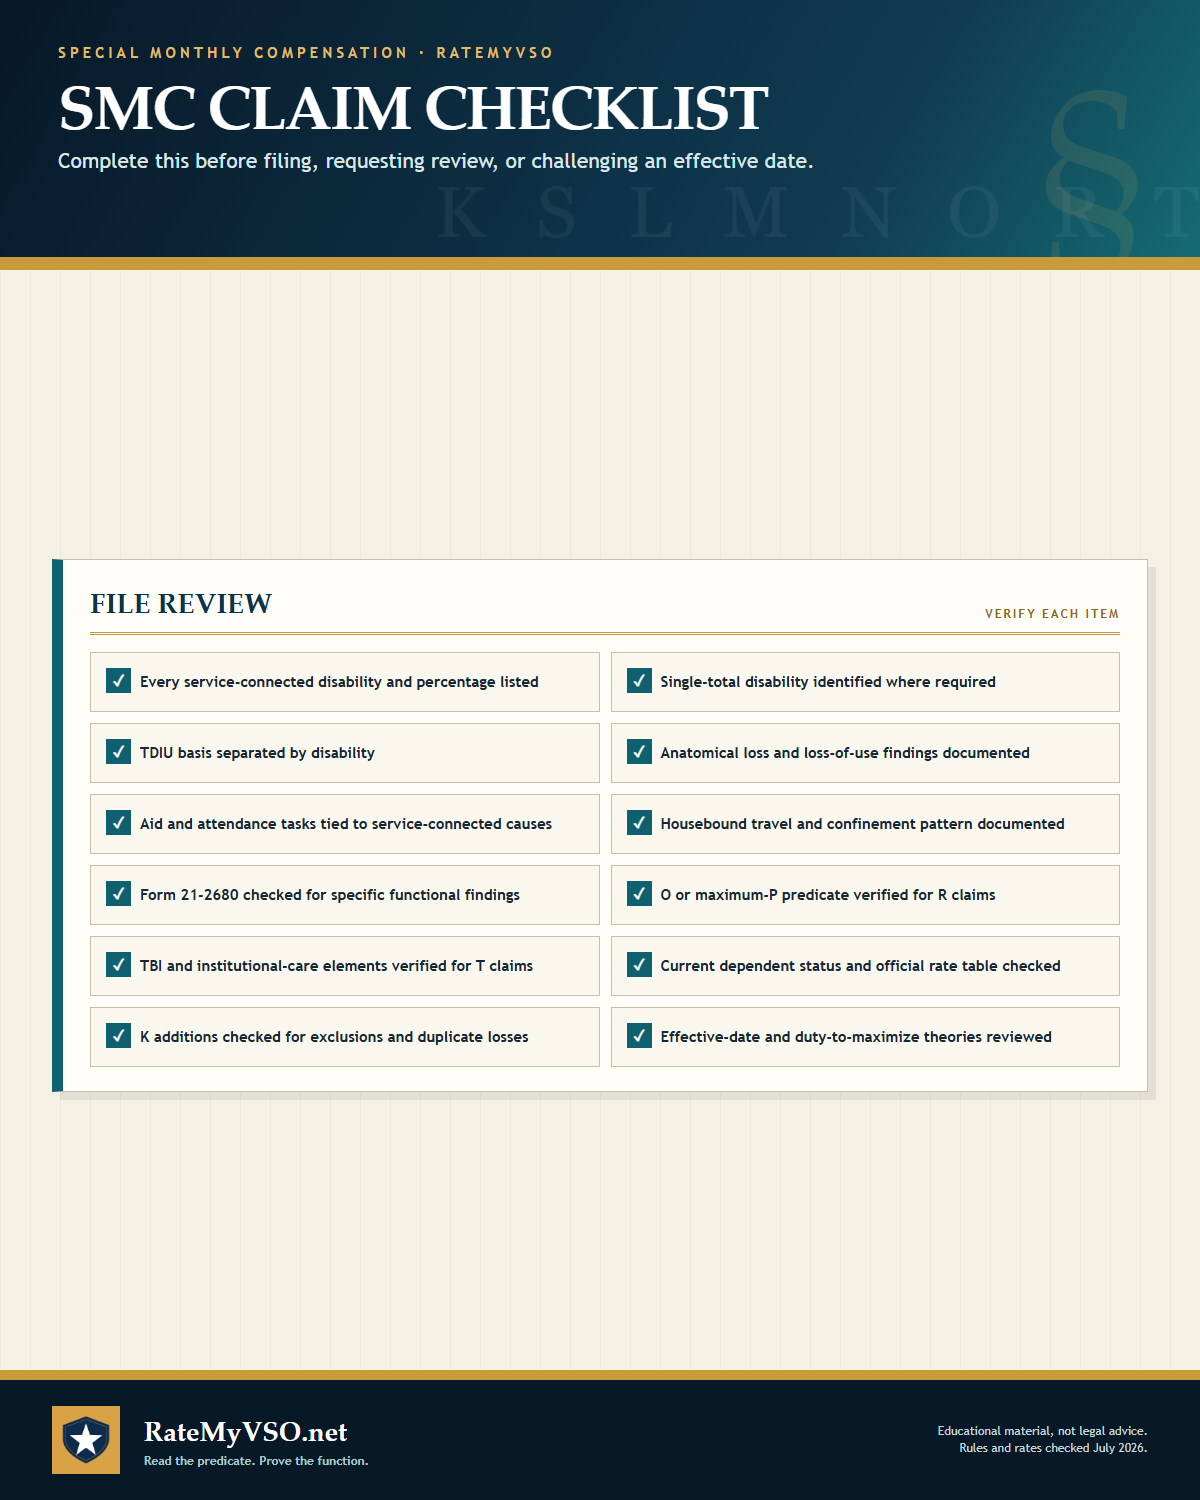
How to use this library
Every guide is a single tall image sized for printing or saving to your phone. Select any card to open the full-resolution image, or use the download link under it. Use the filter to narrow to one part of the question. The level and evidence charts summarize the published rules; the research charts report what RateMyVSO measured in published Board decisions, with the denominator printed on the chart itself.
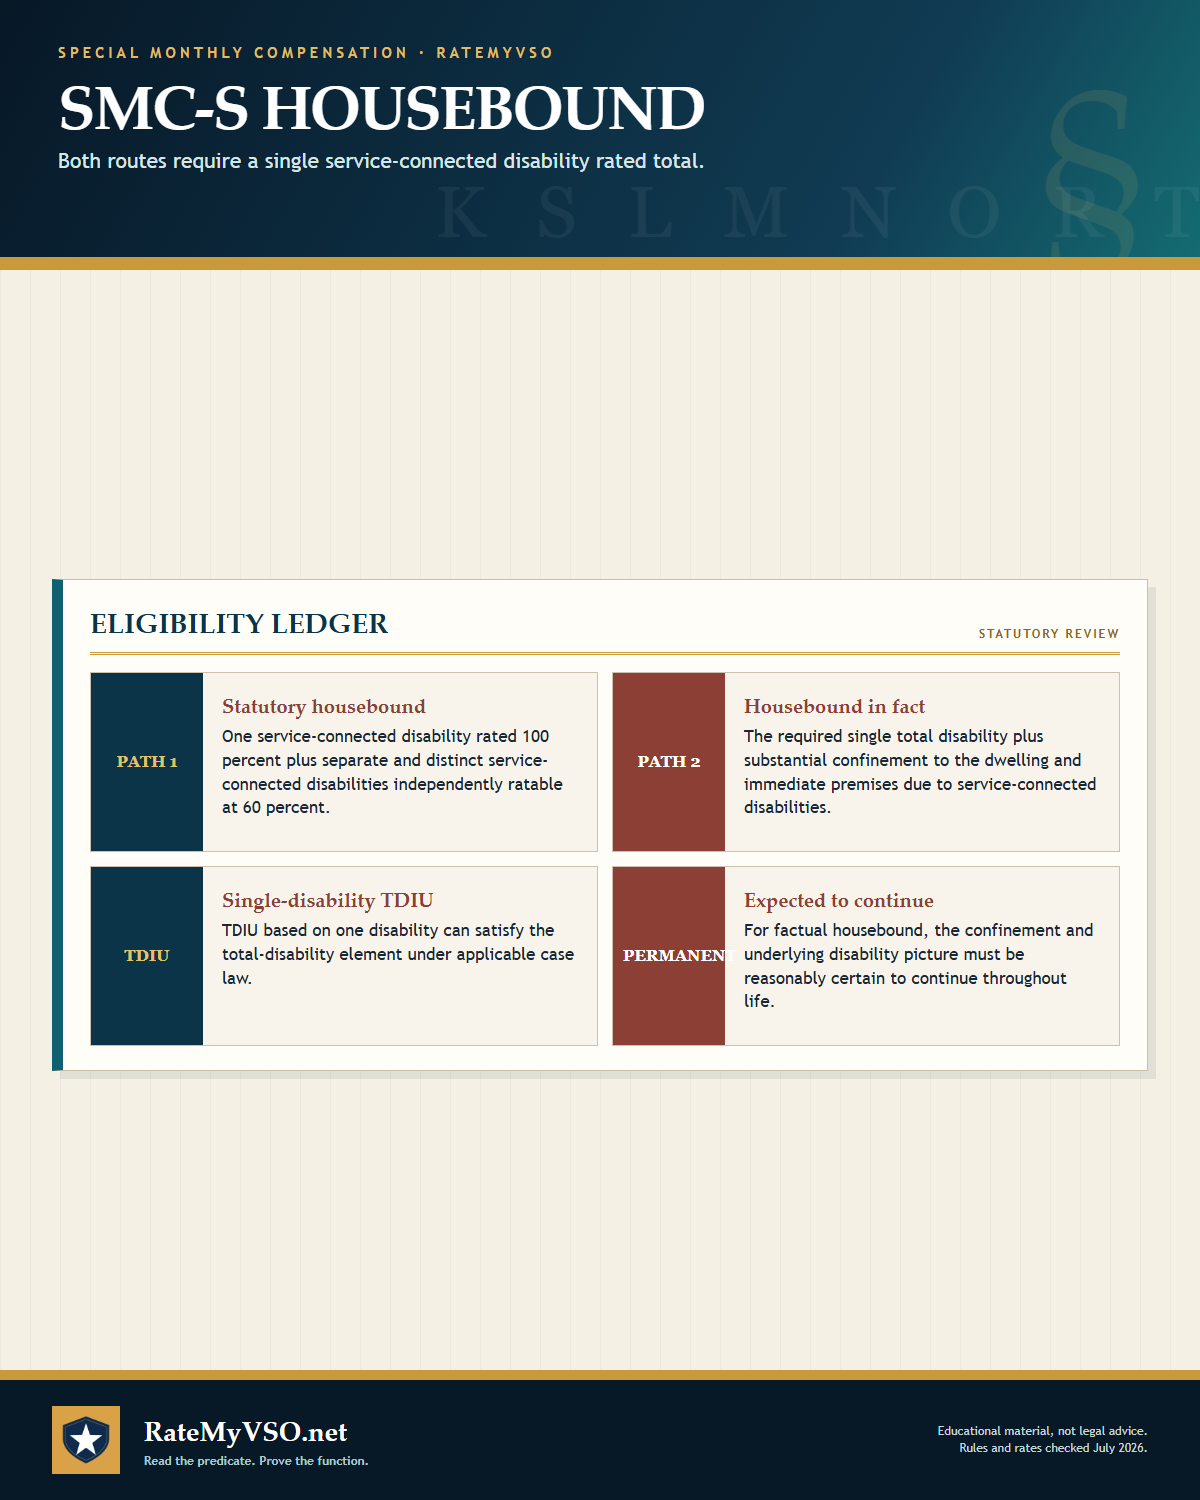
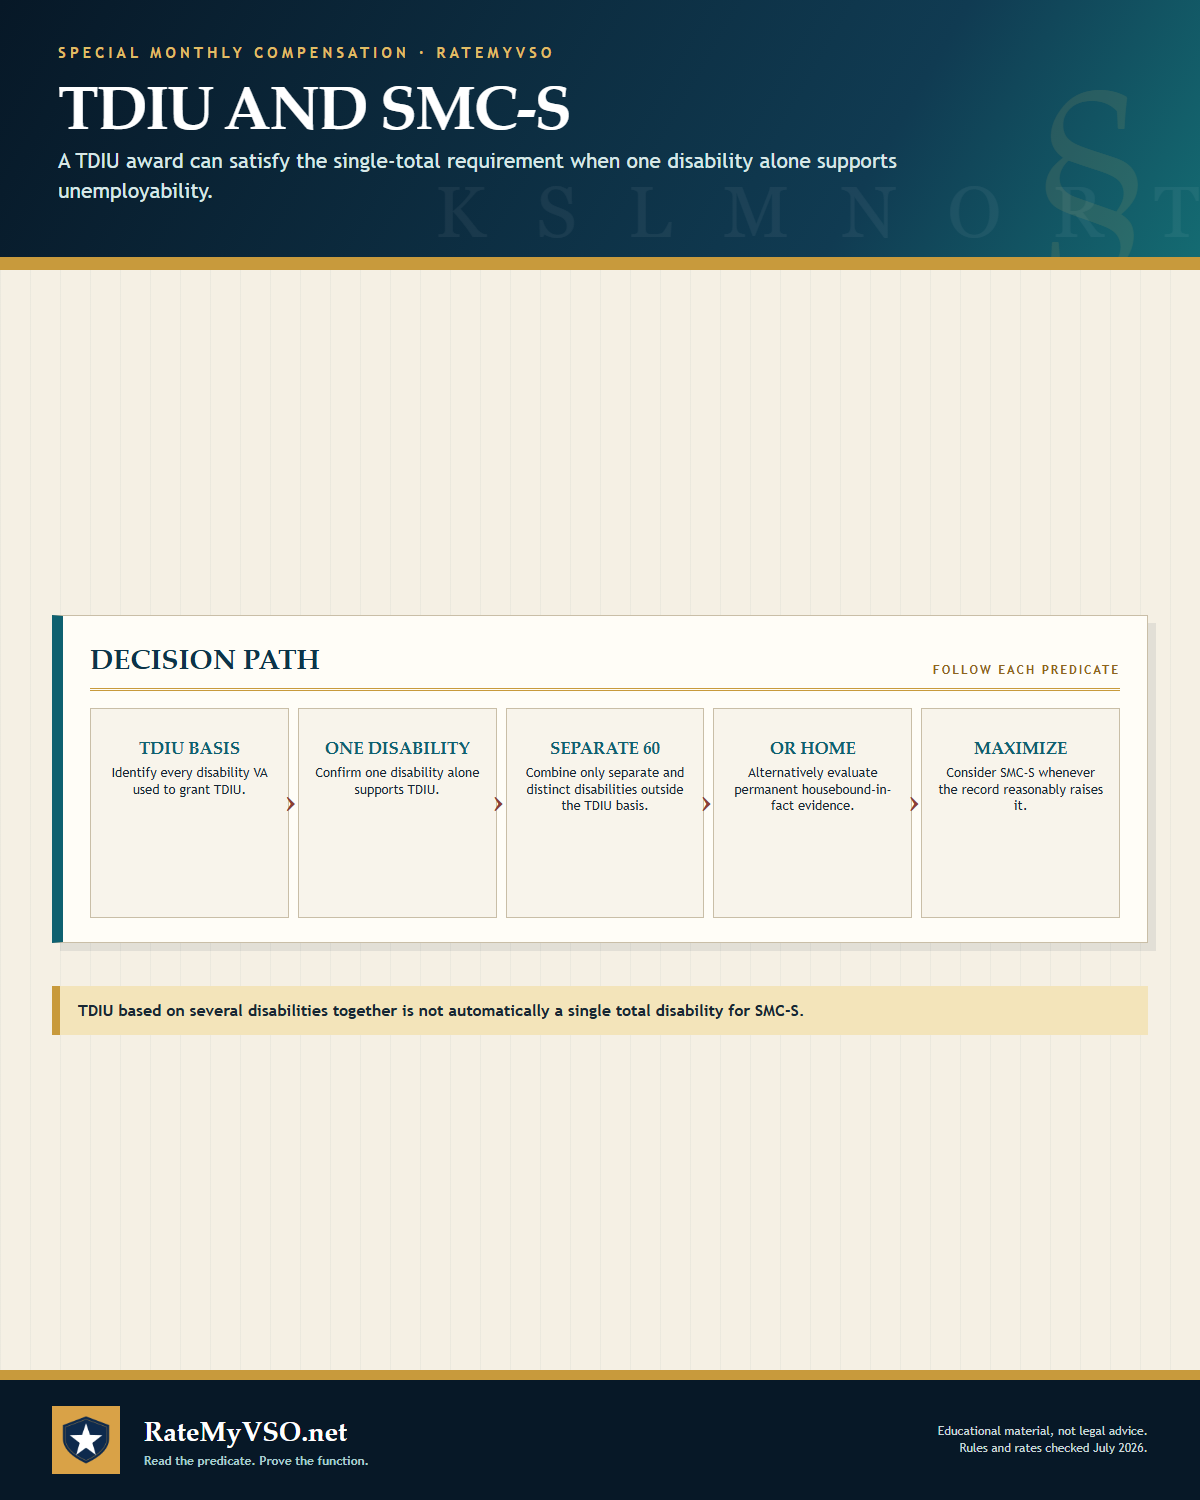
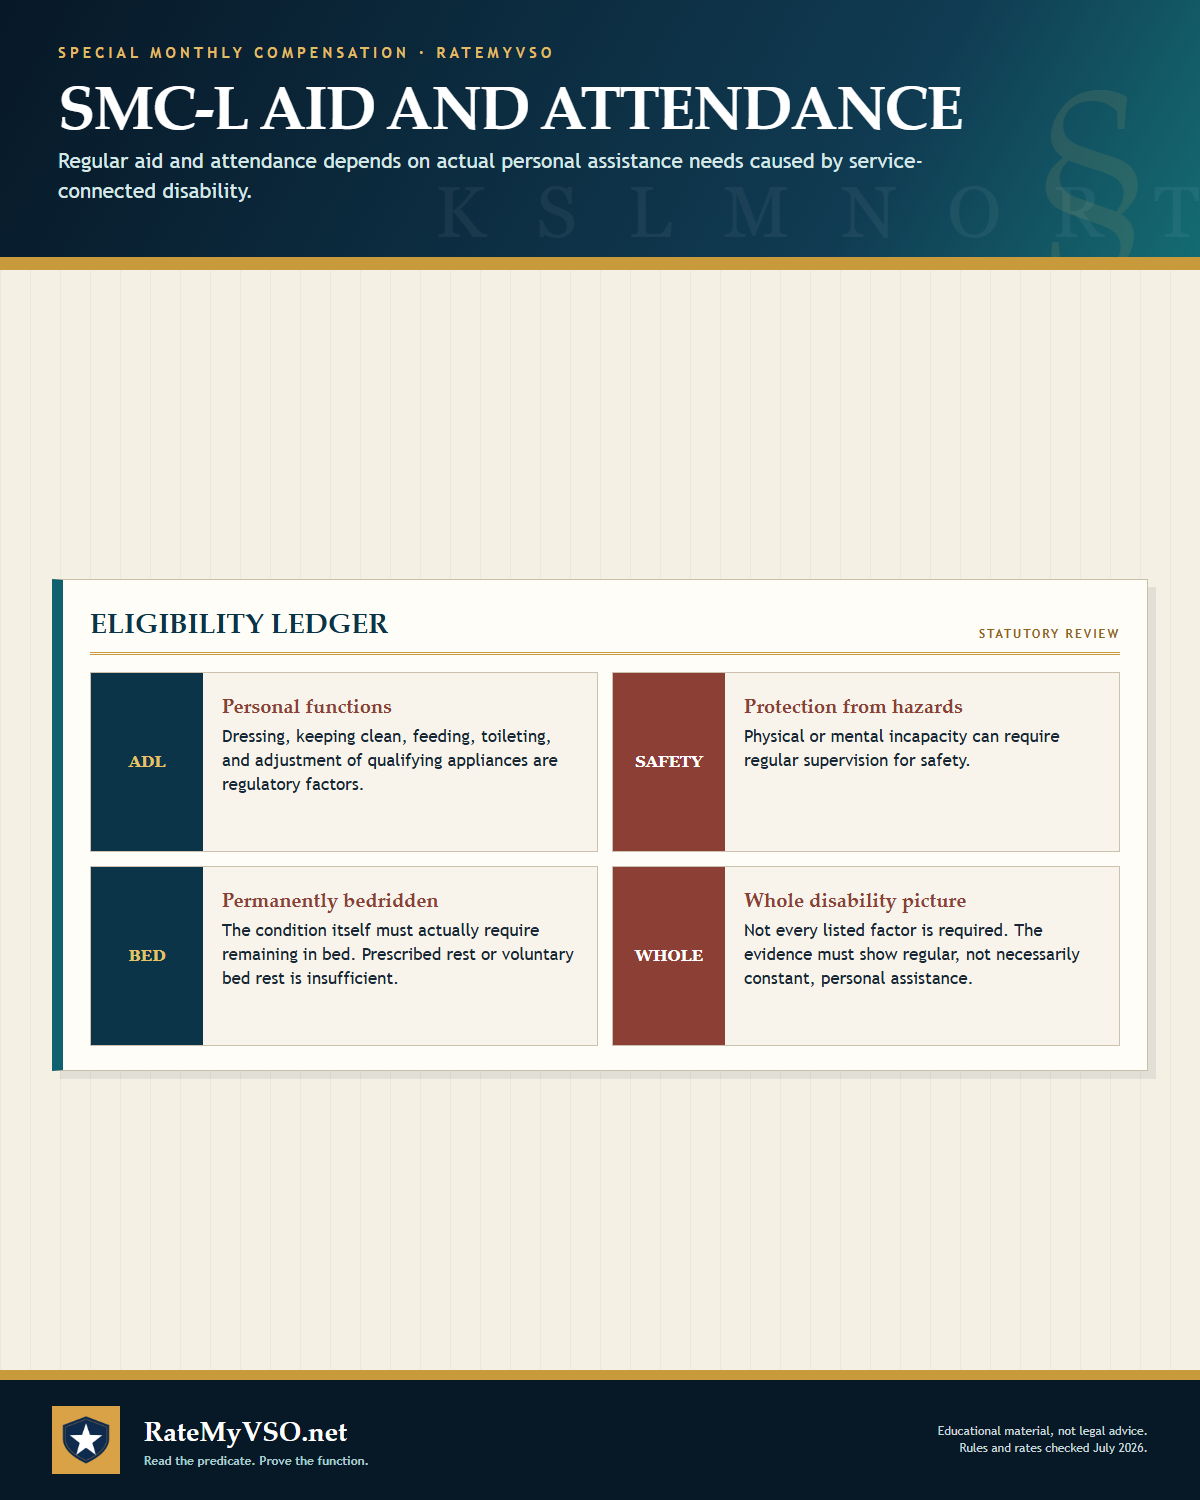
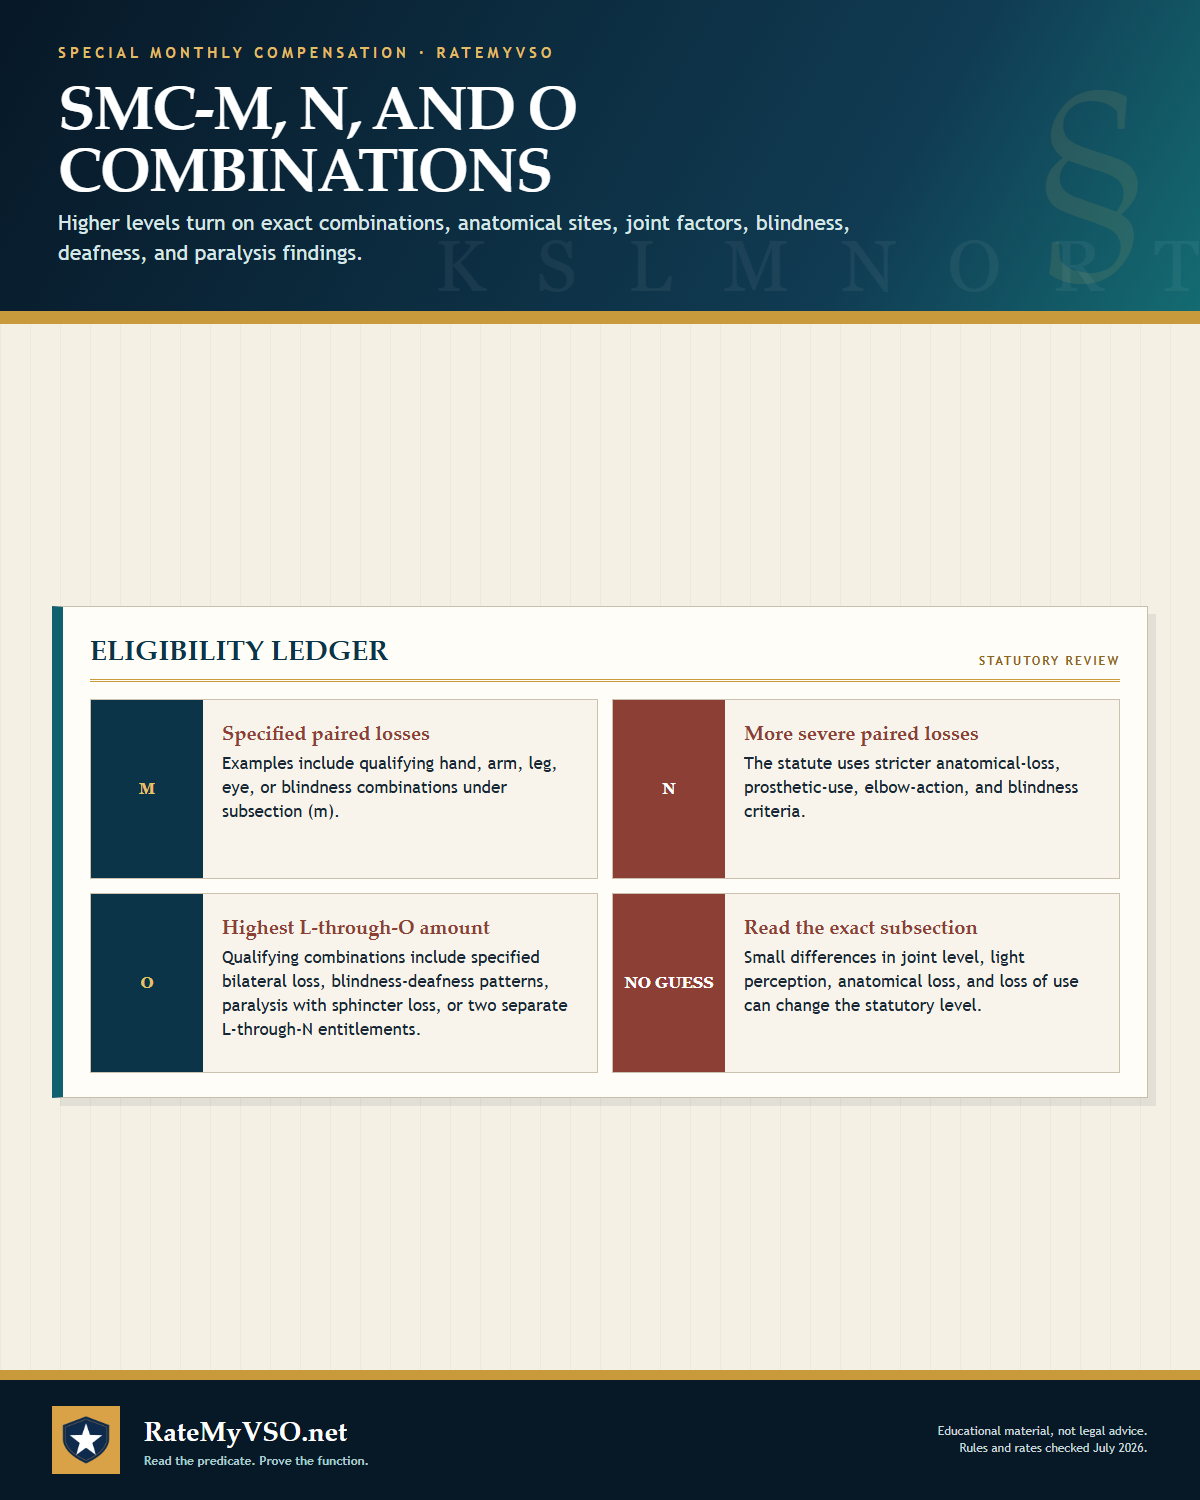
These charts catalogue the published rules and what appears in published Board decisions. Every SMC level has its own legal predicate and these charts keep them apart, because that is where most SMC confusion starts: SMC-K is an add-on for a specified loss, SMC-S turns on a single total plus 60 percent or on being housebound, the L through O ladder turns on anatomical losses and aid and attendance, SMC-R requires entitlement to SMC-O or the maximum SMC-P rate, and SMC-T is a separate TBI route that requires neither. Compensation aid and attendance is not the same benefit as pension aid and attendance. In the research charts, a level being mentioned in a decision is not a claim, a grant, or a veteran, and a grant rate counts granted against granted plus denied, so remands and procedural outcomes are excluded and it is not a share of everything filed. Denial themes overlap and do not add to 100 percent. The 2026 rate chart changes every December 1. These charts are not legal or medical advice. For the full written guidance, start with the SMC guide.