Cancer Visual Guide Library
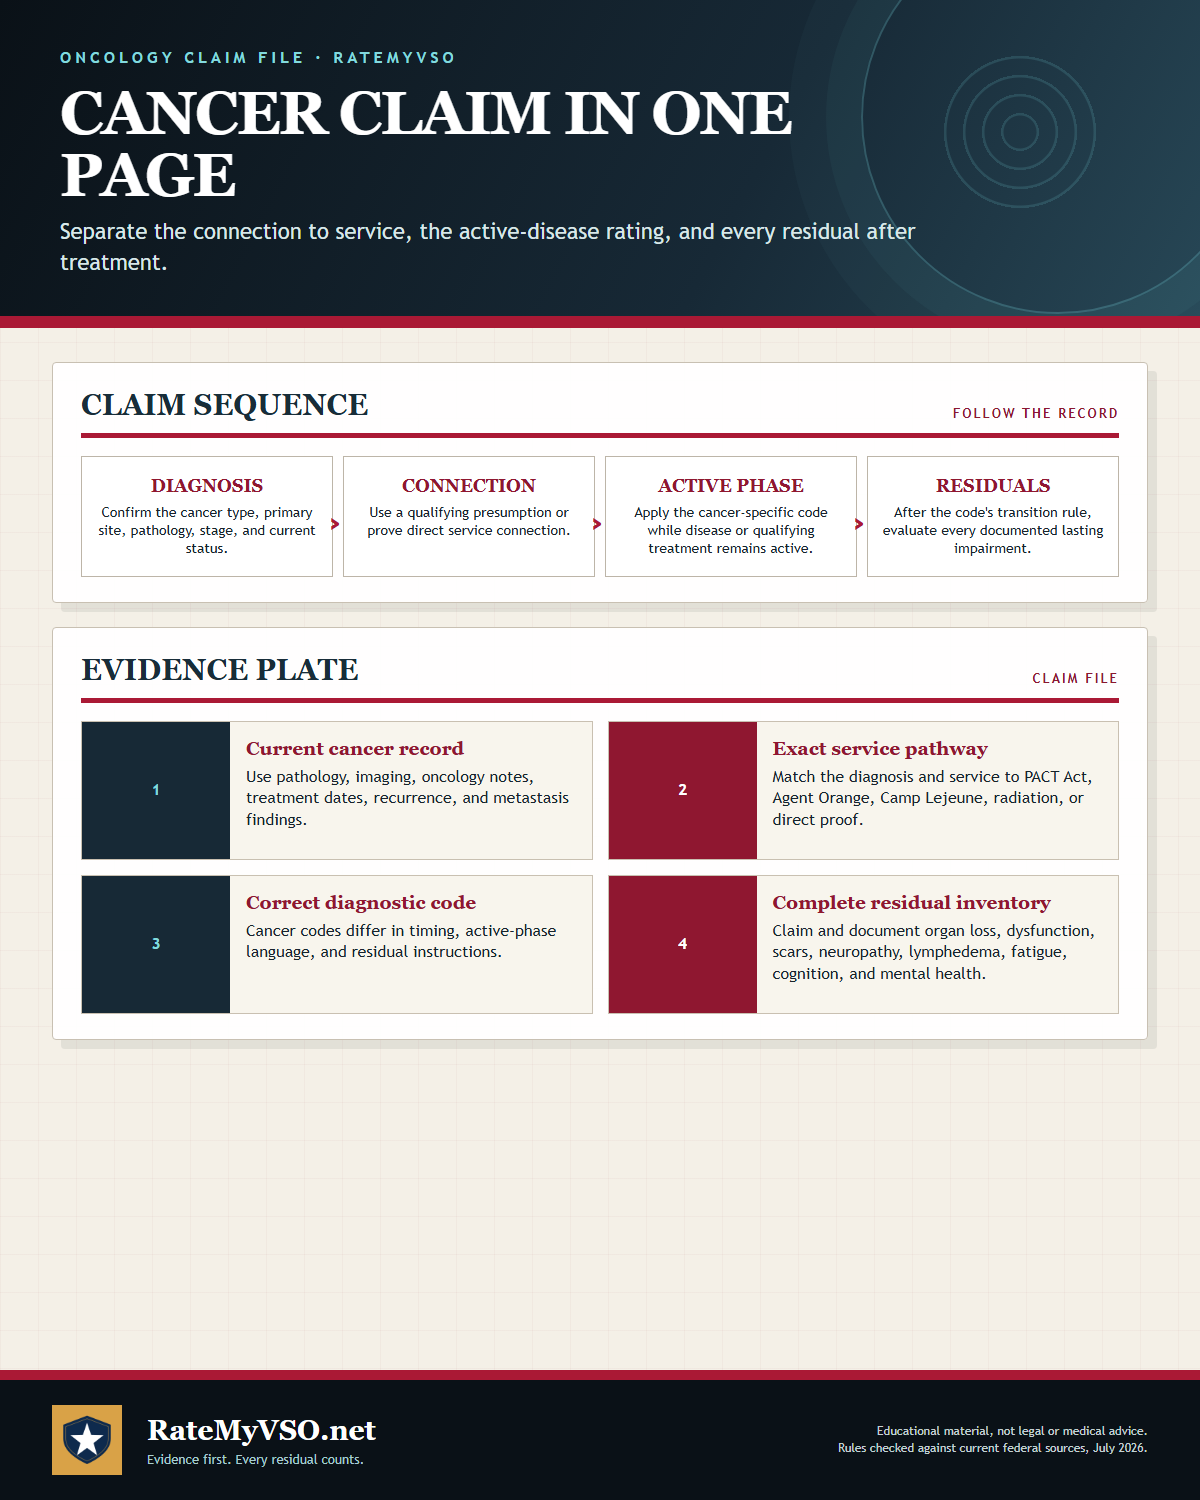
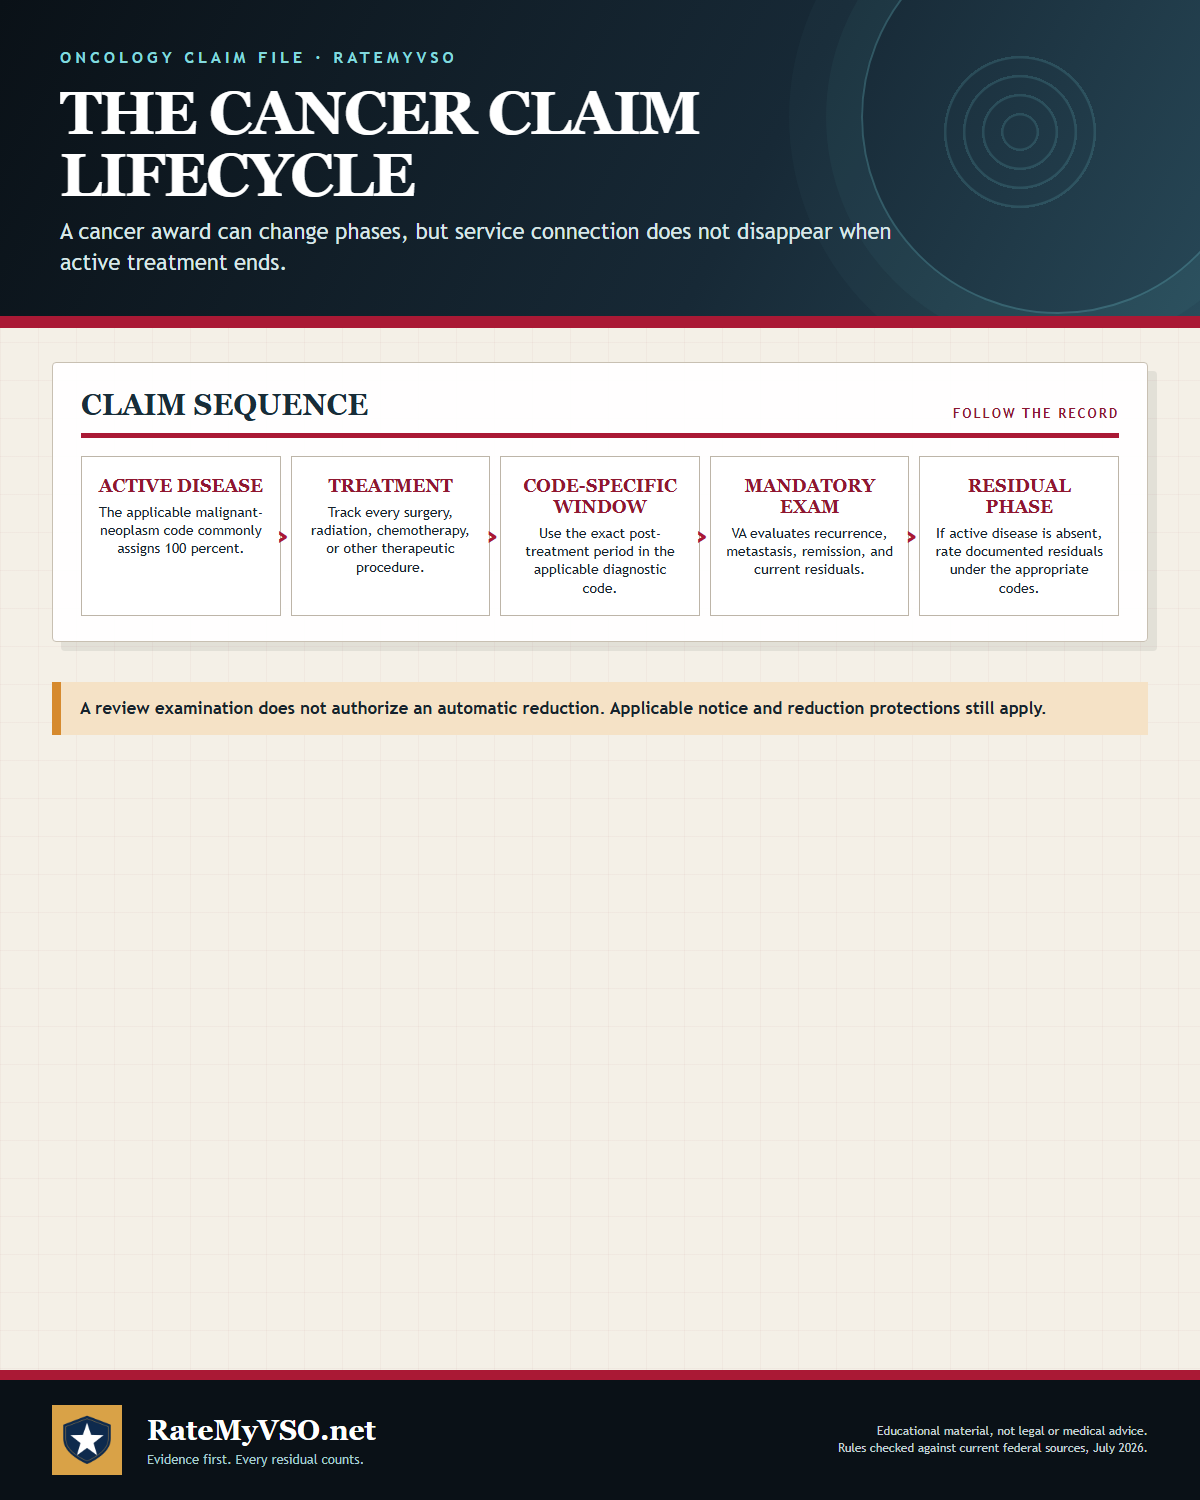
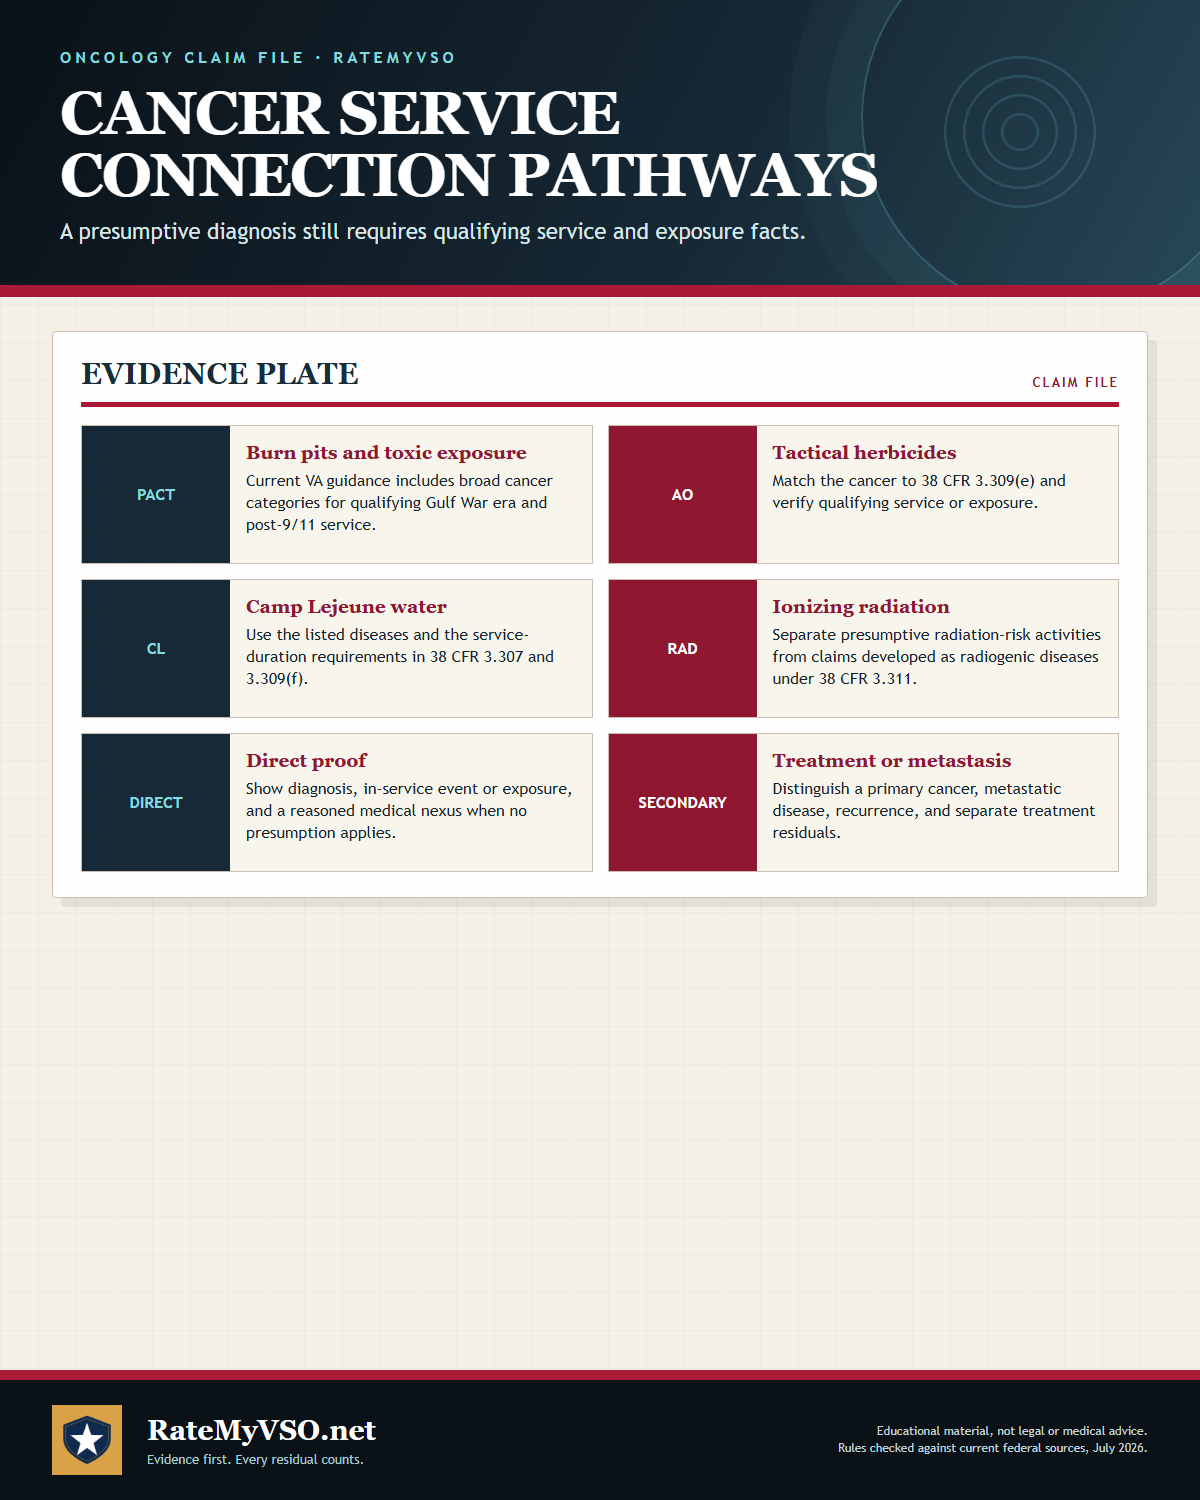
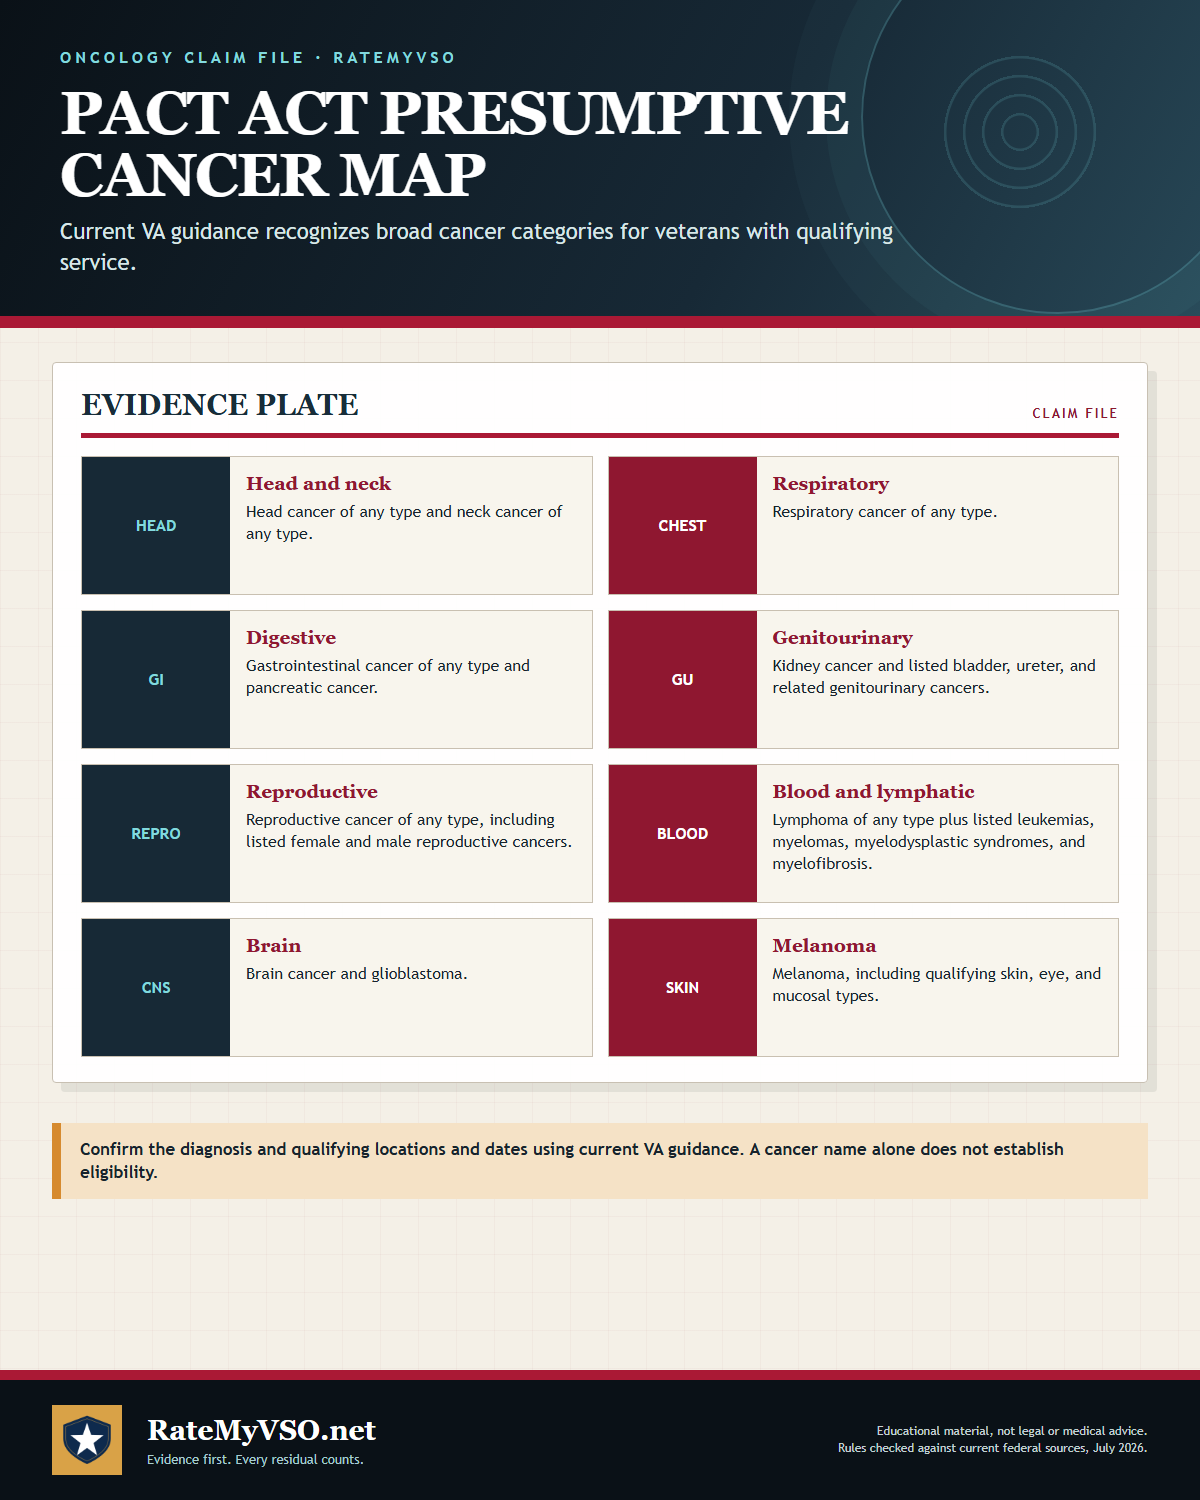
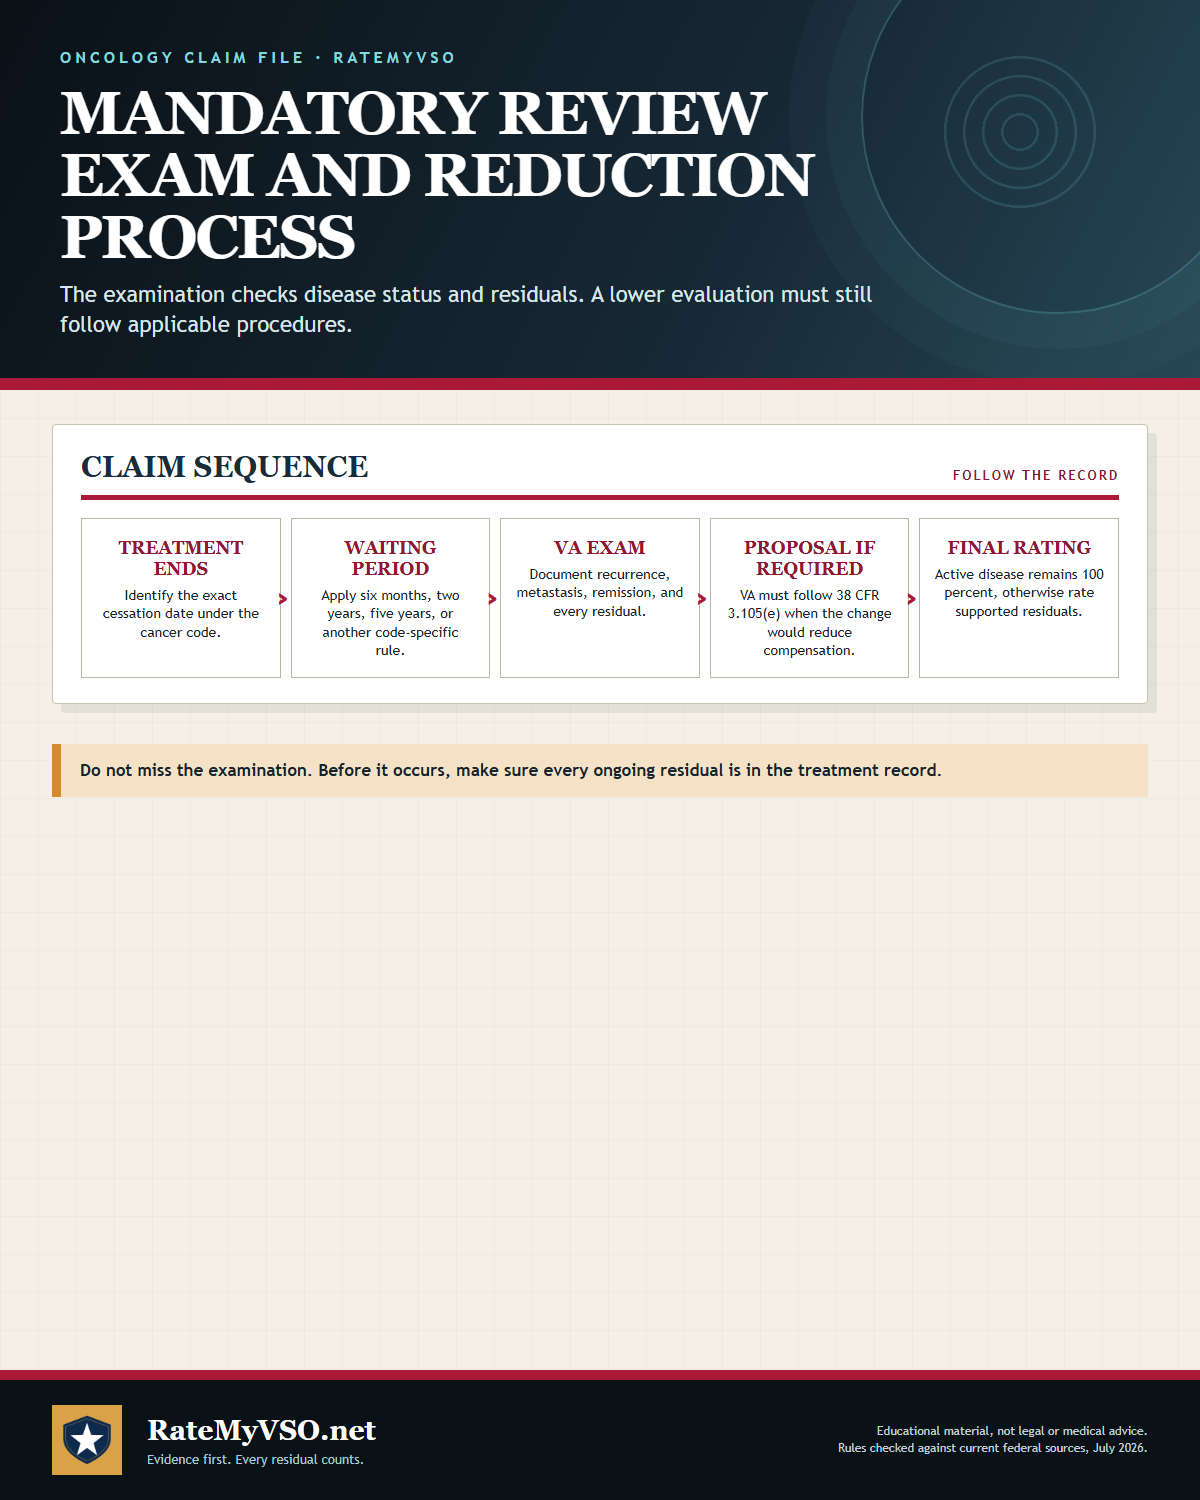
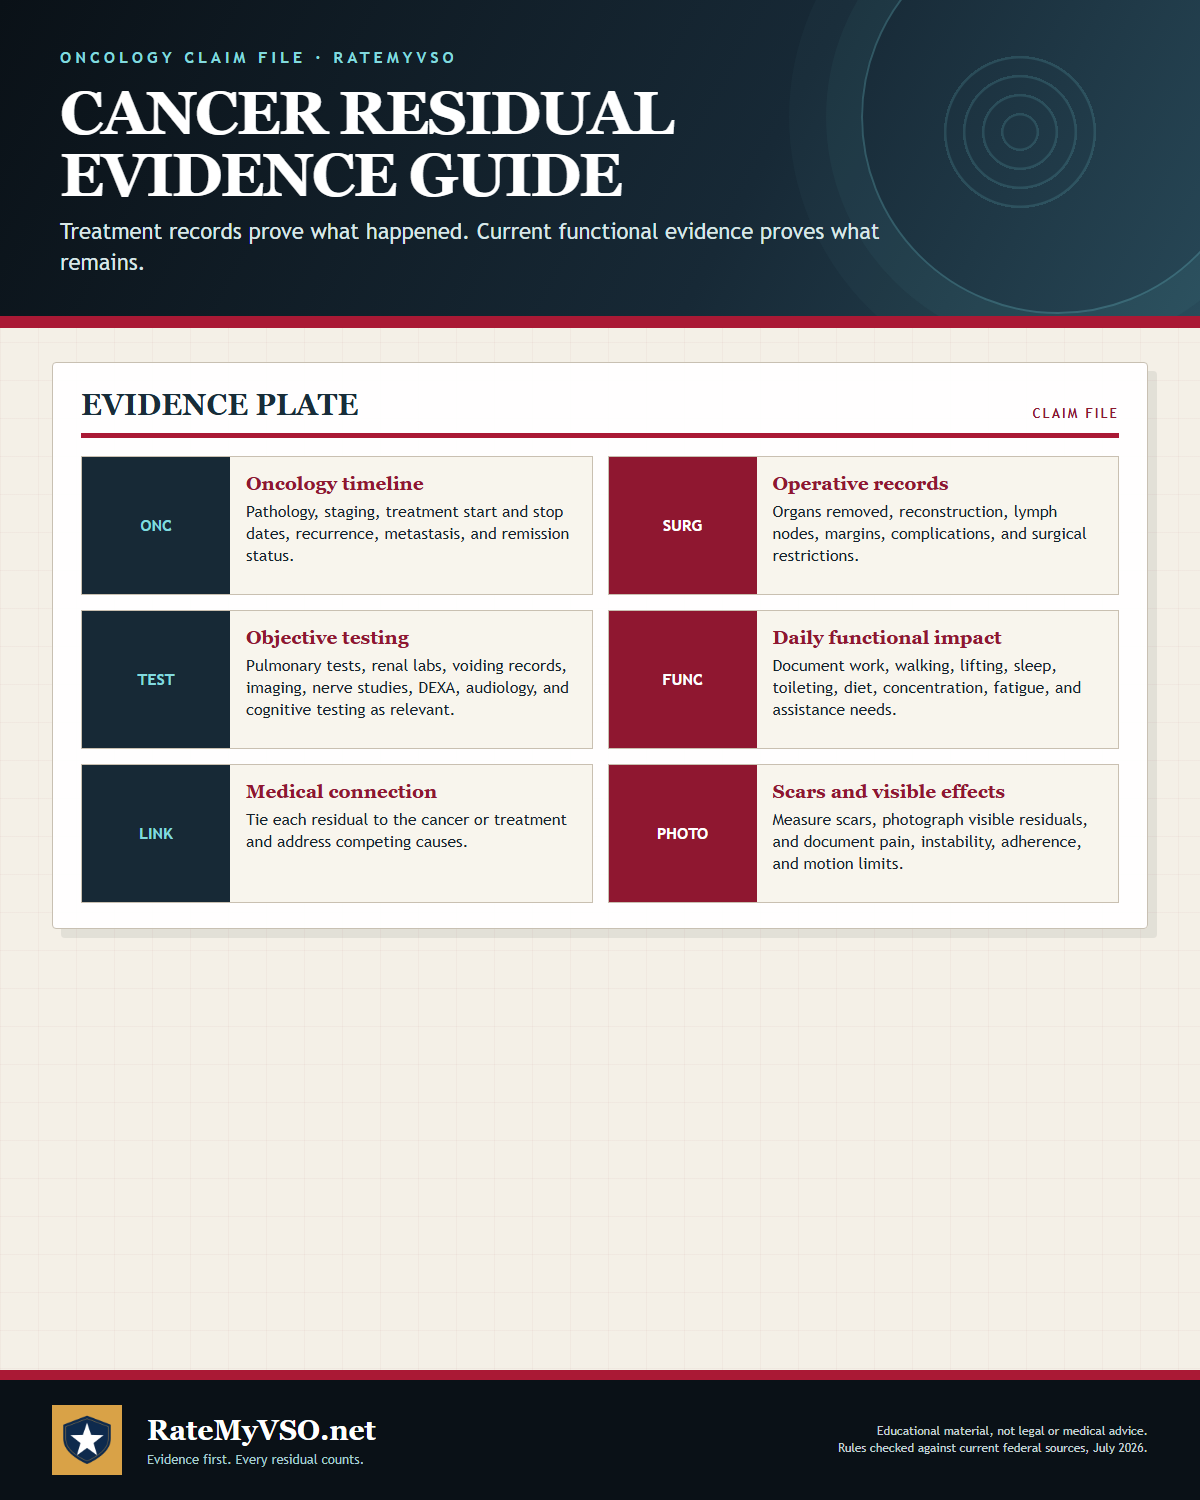
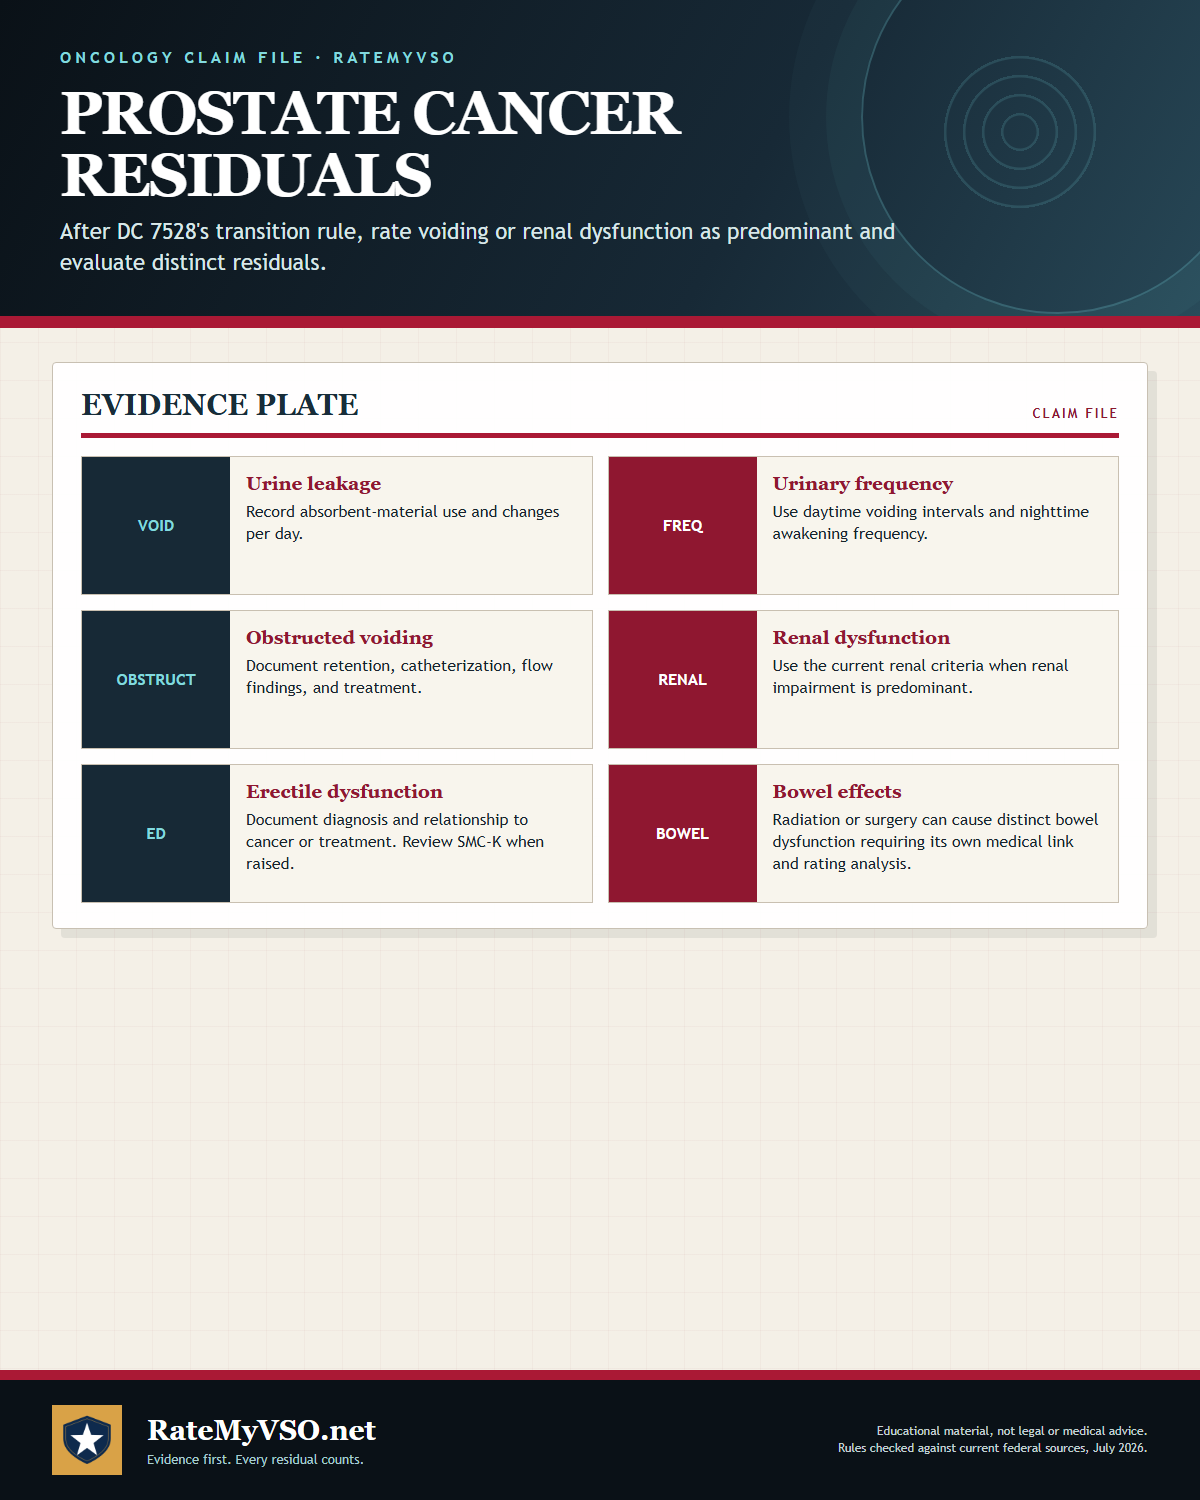
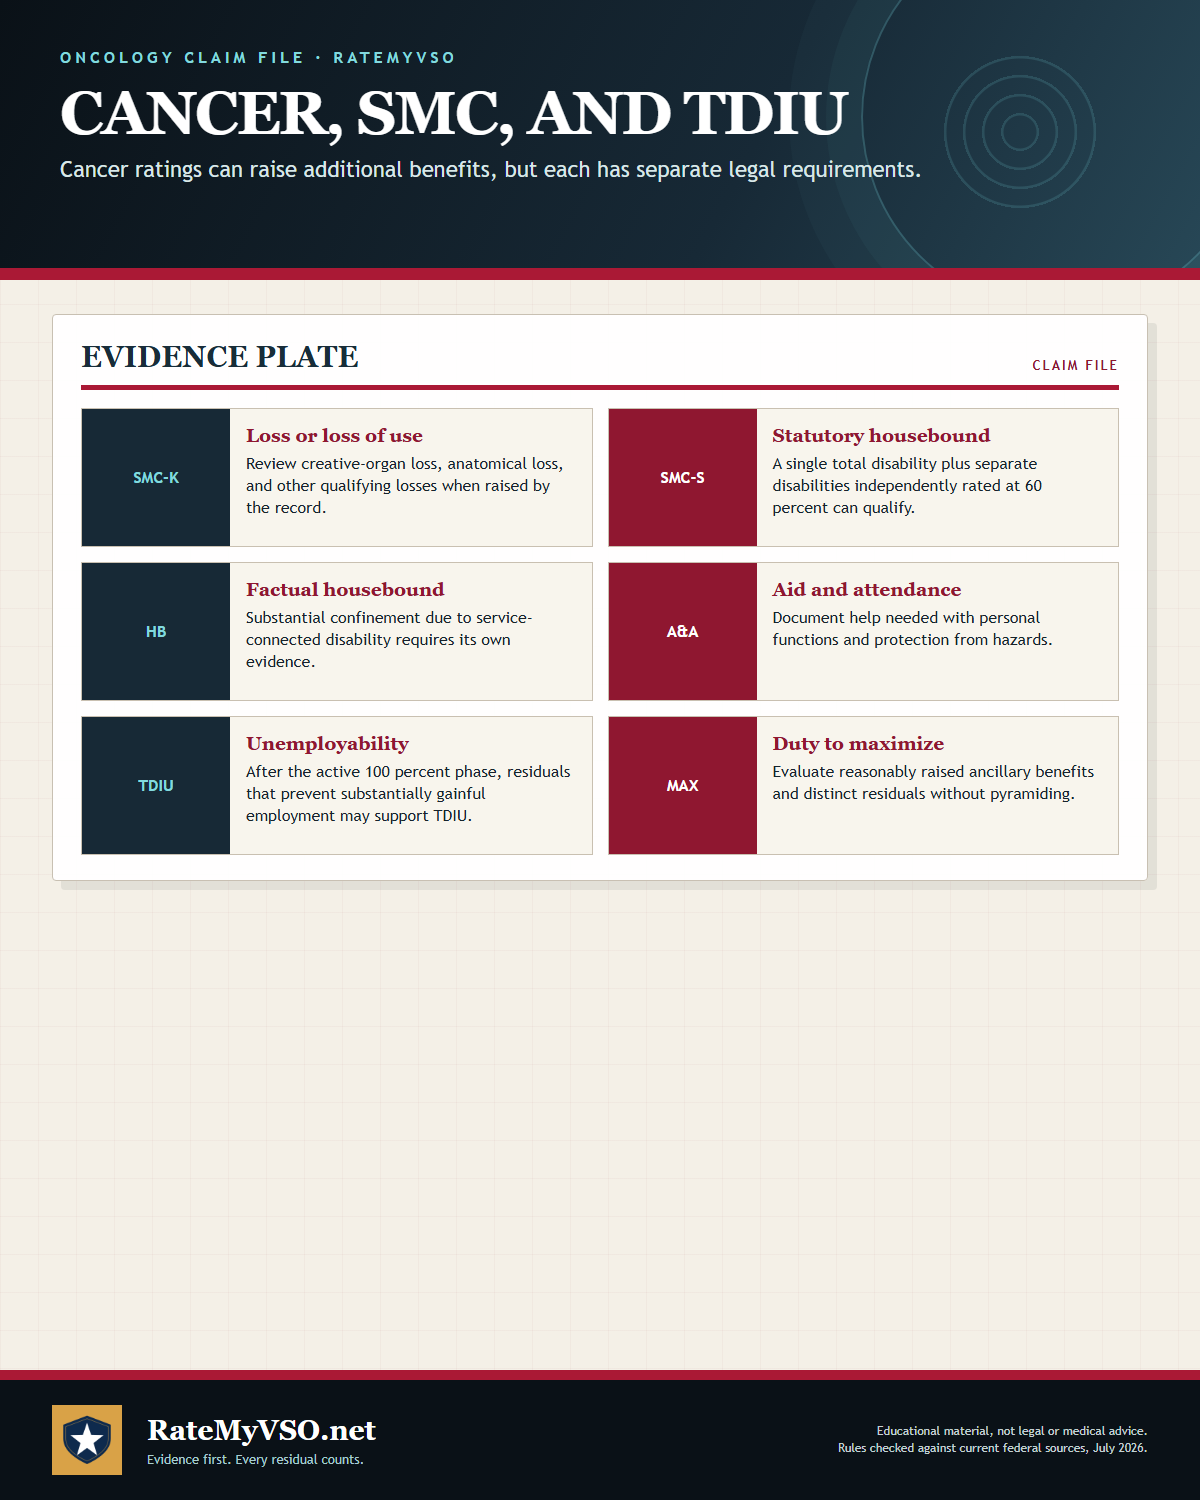
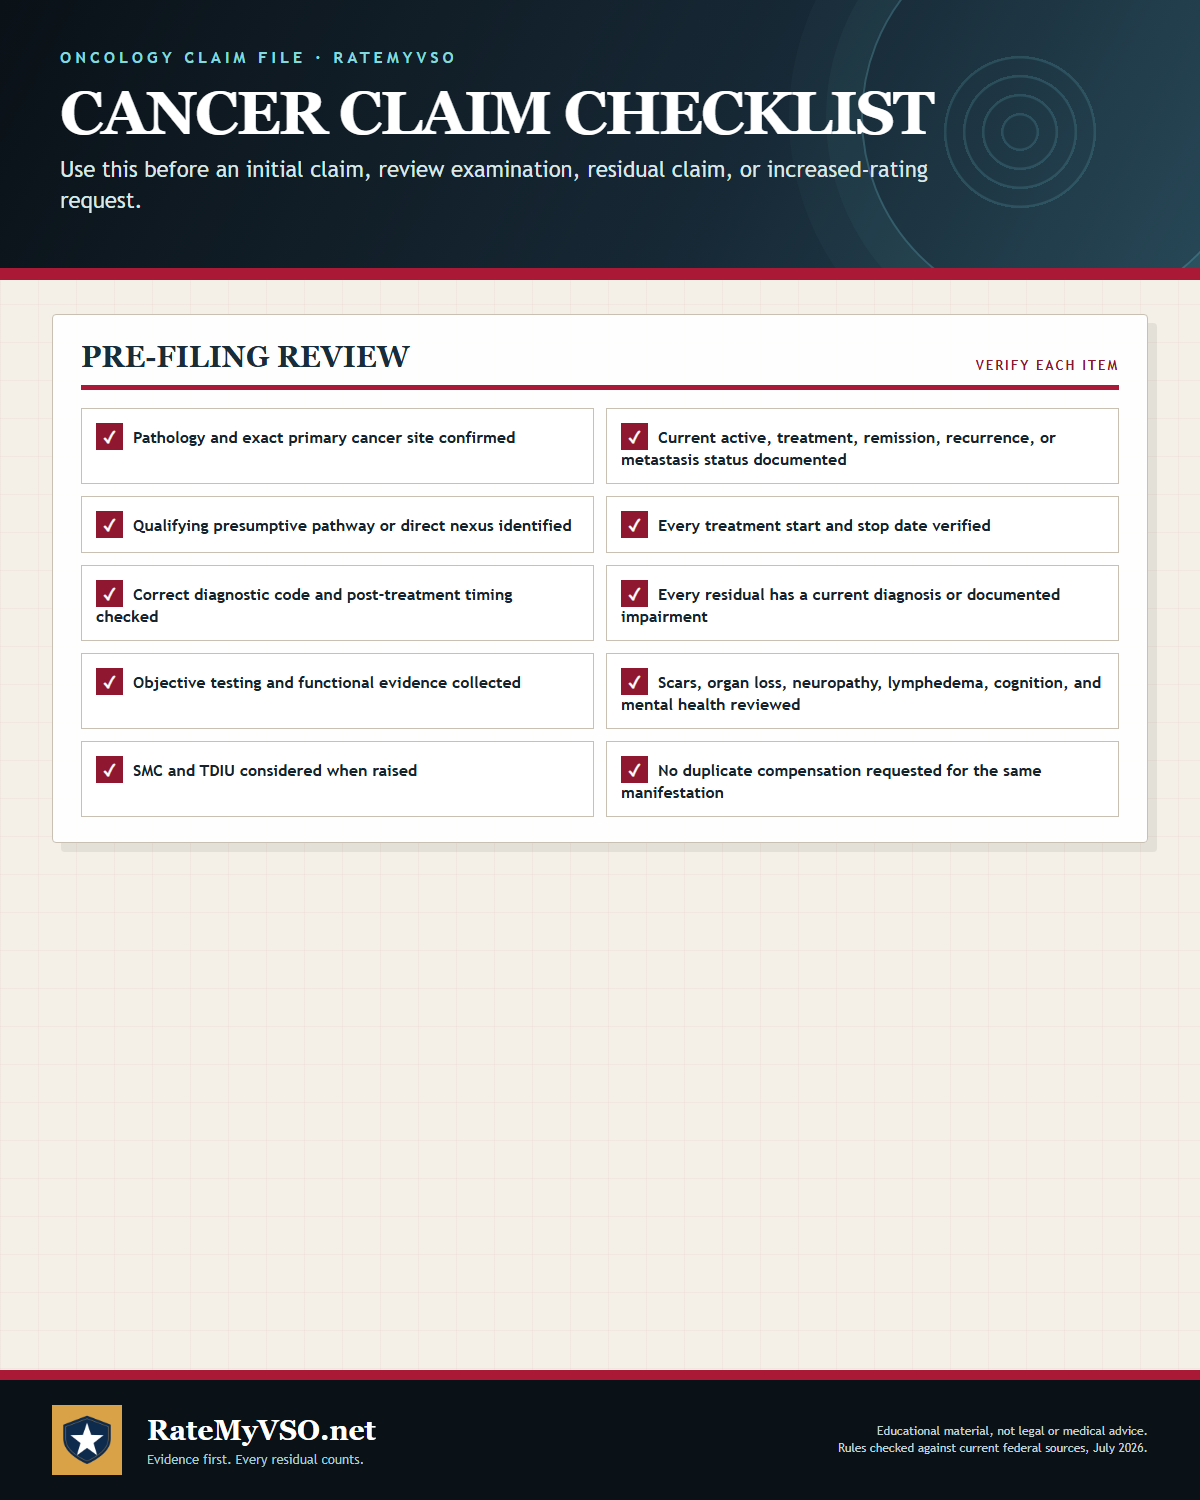
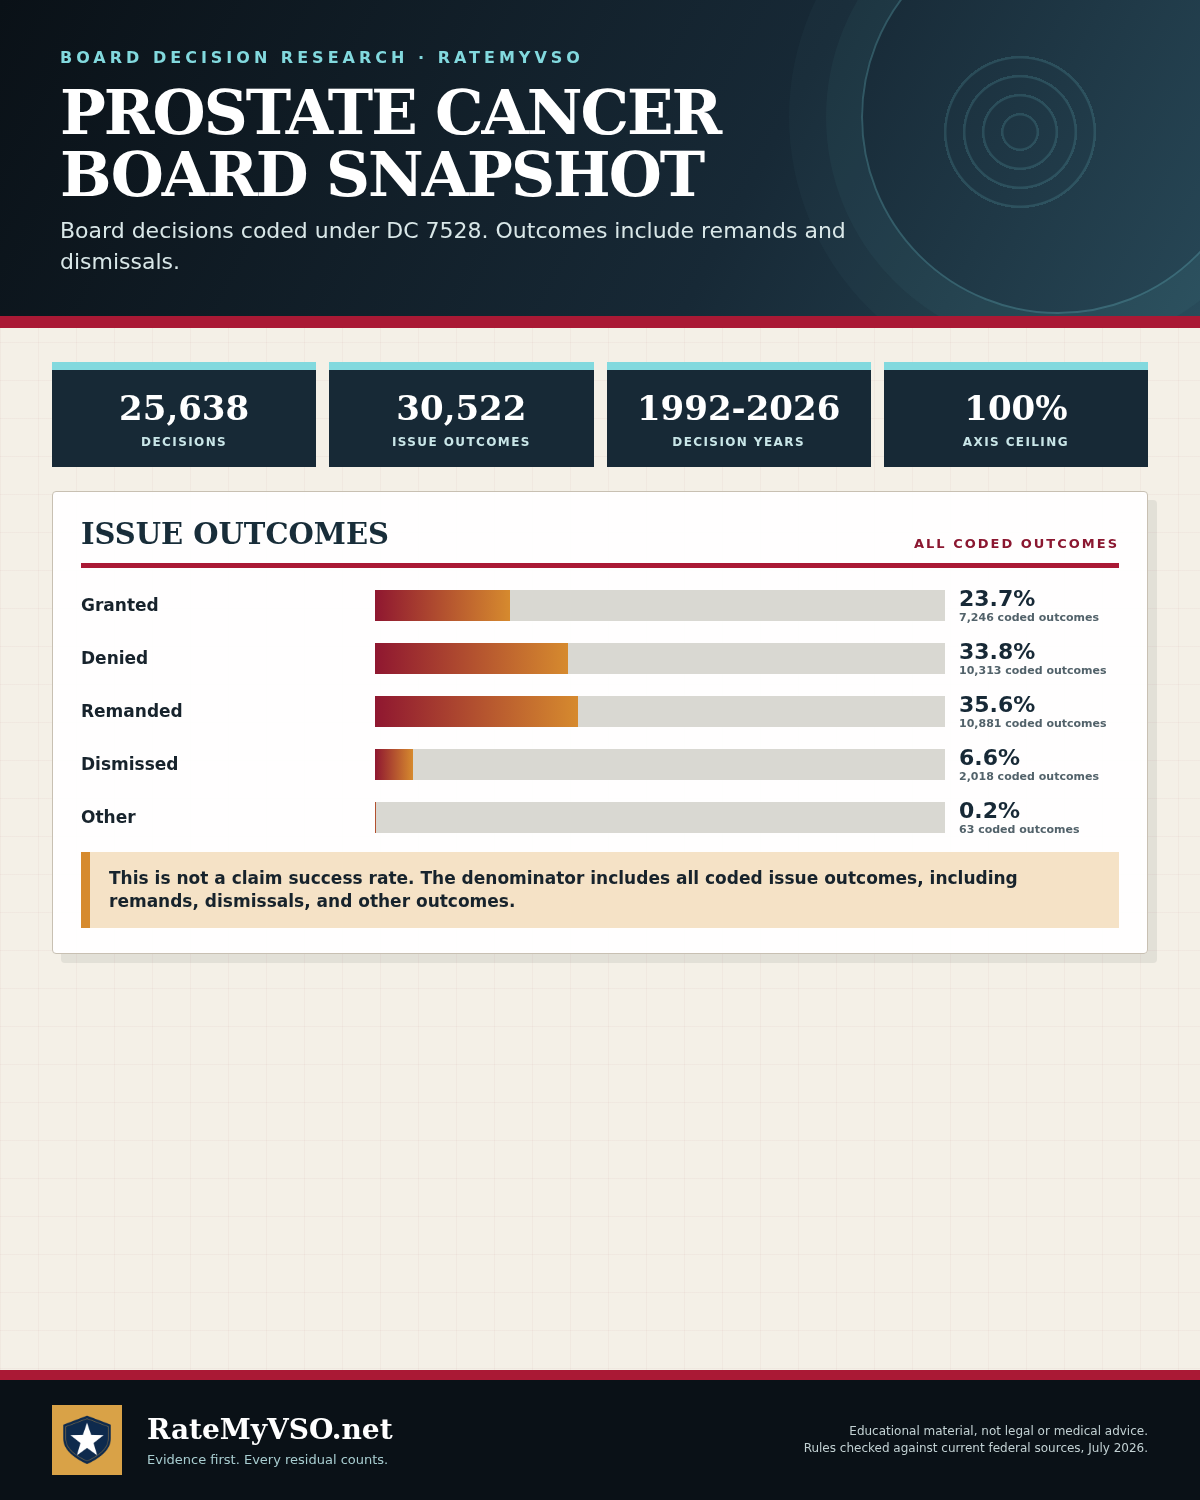
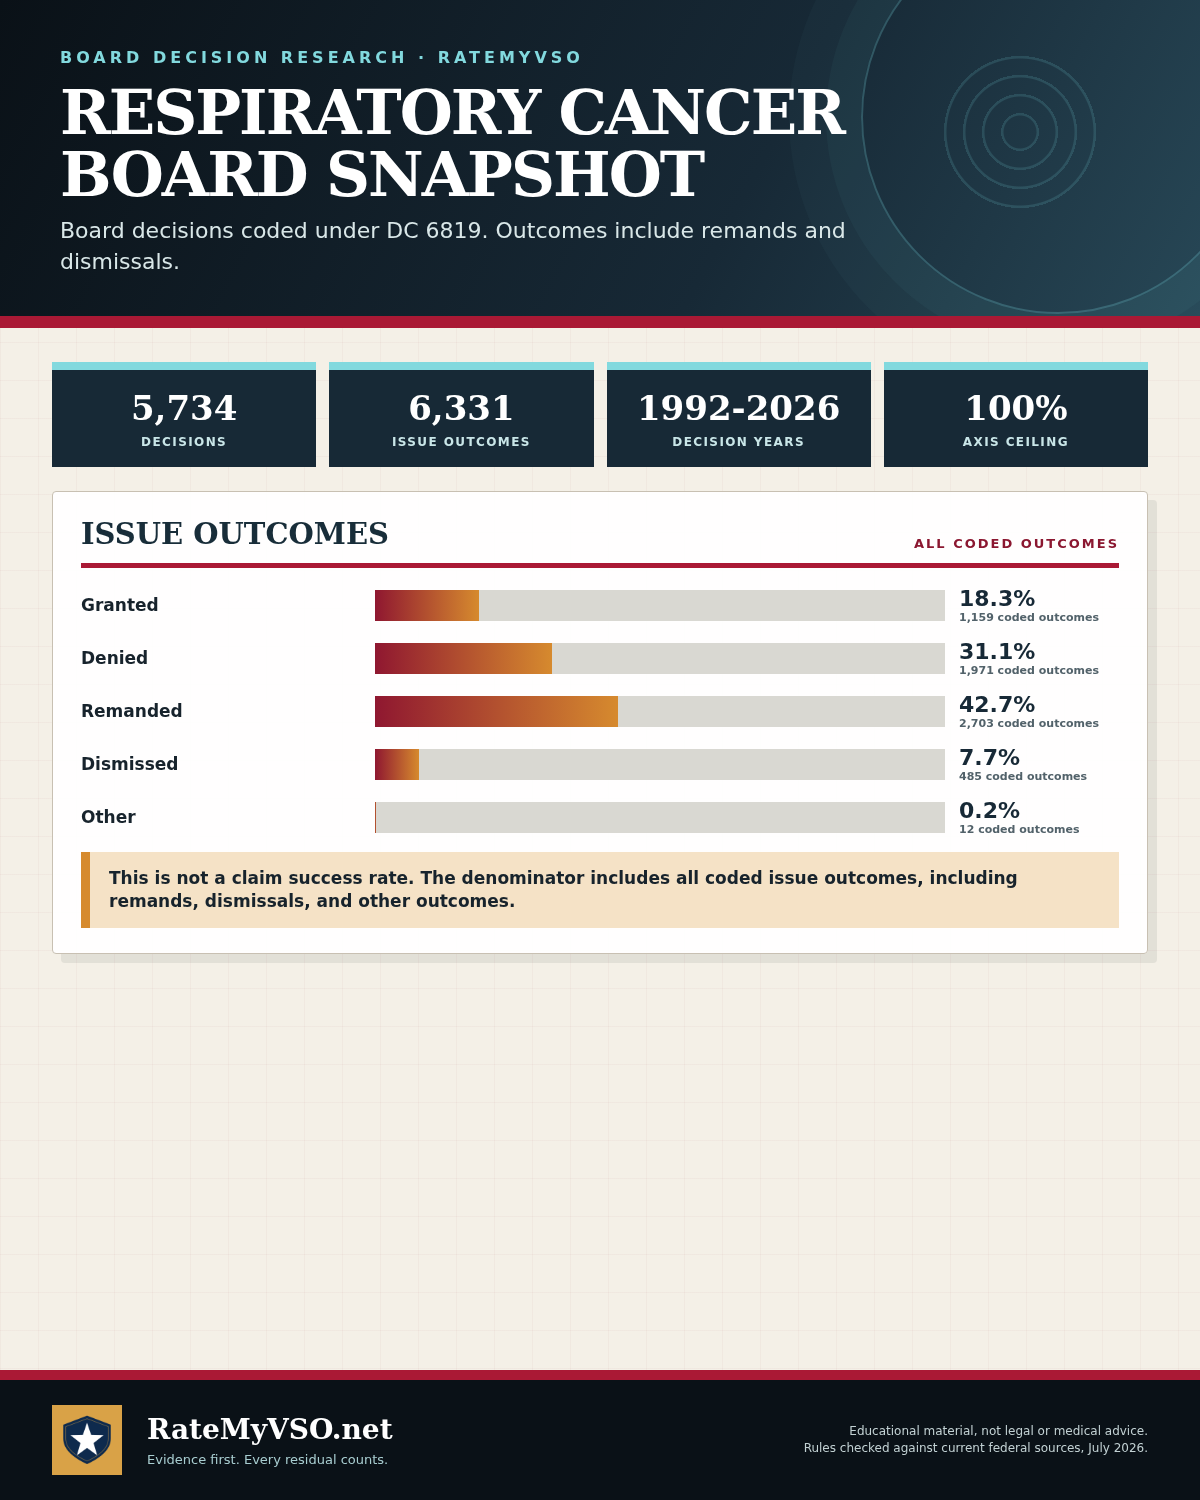
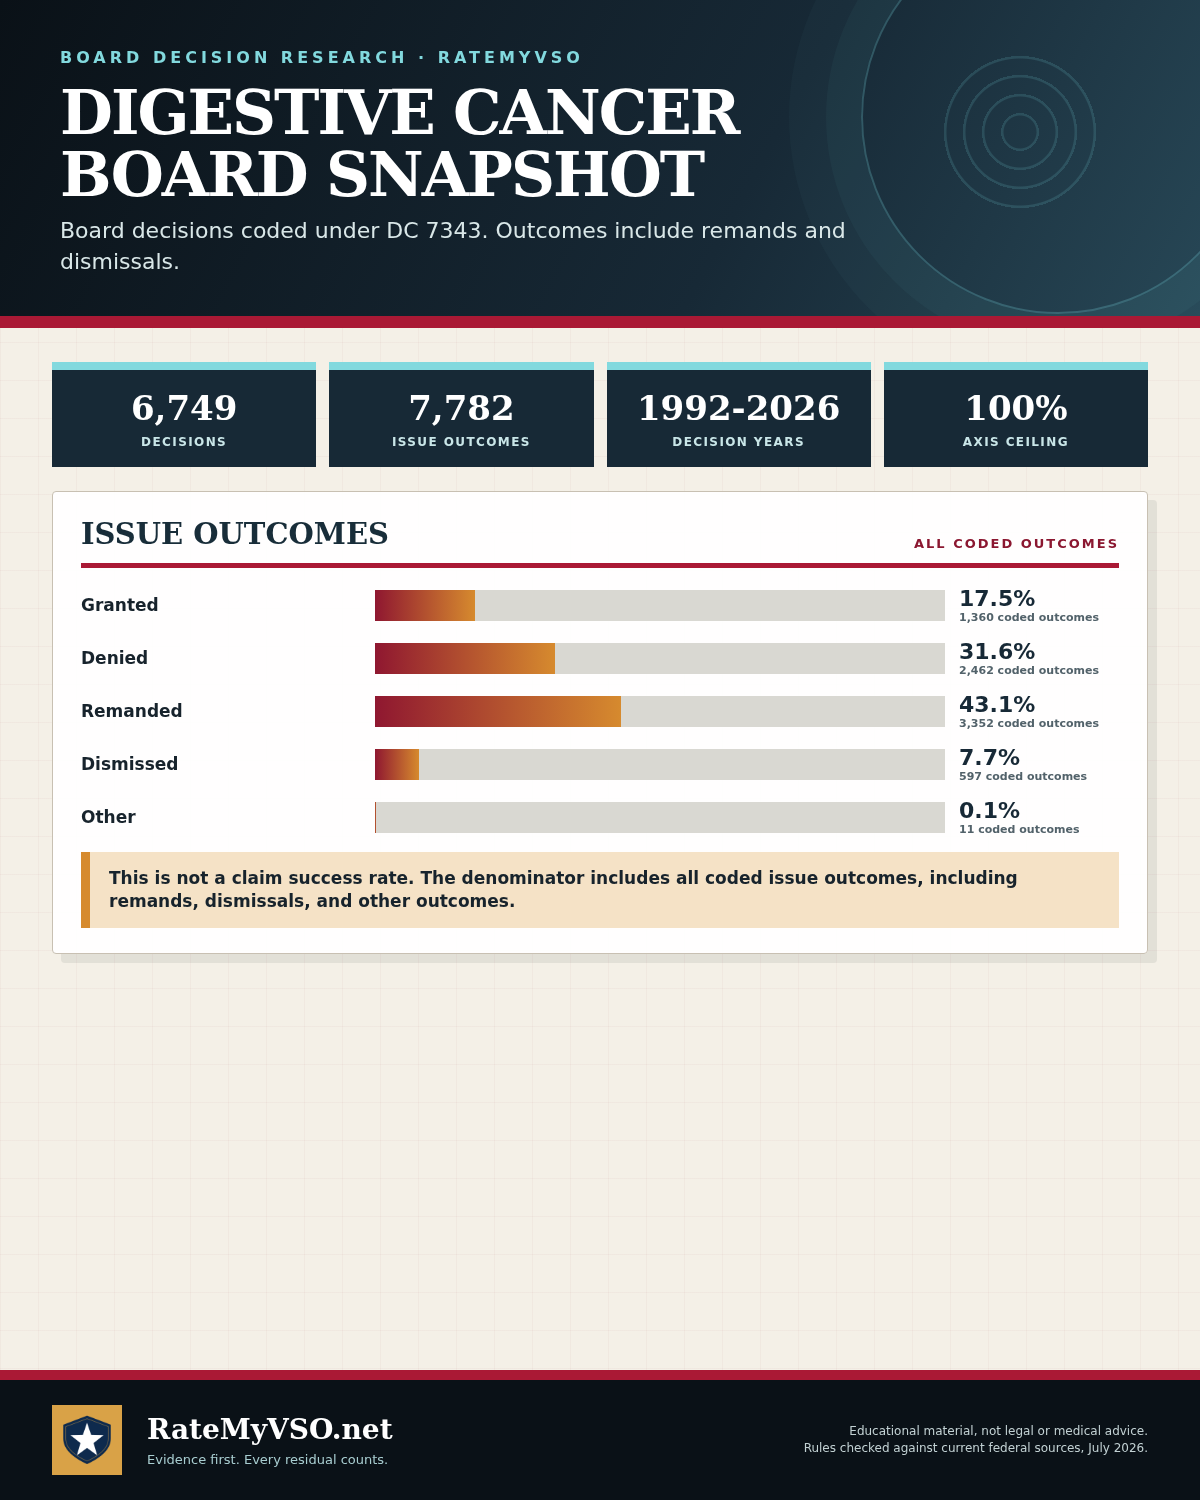
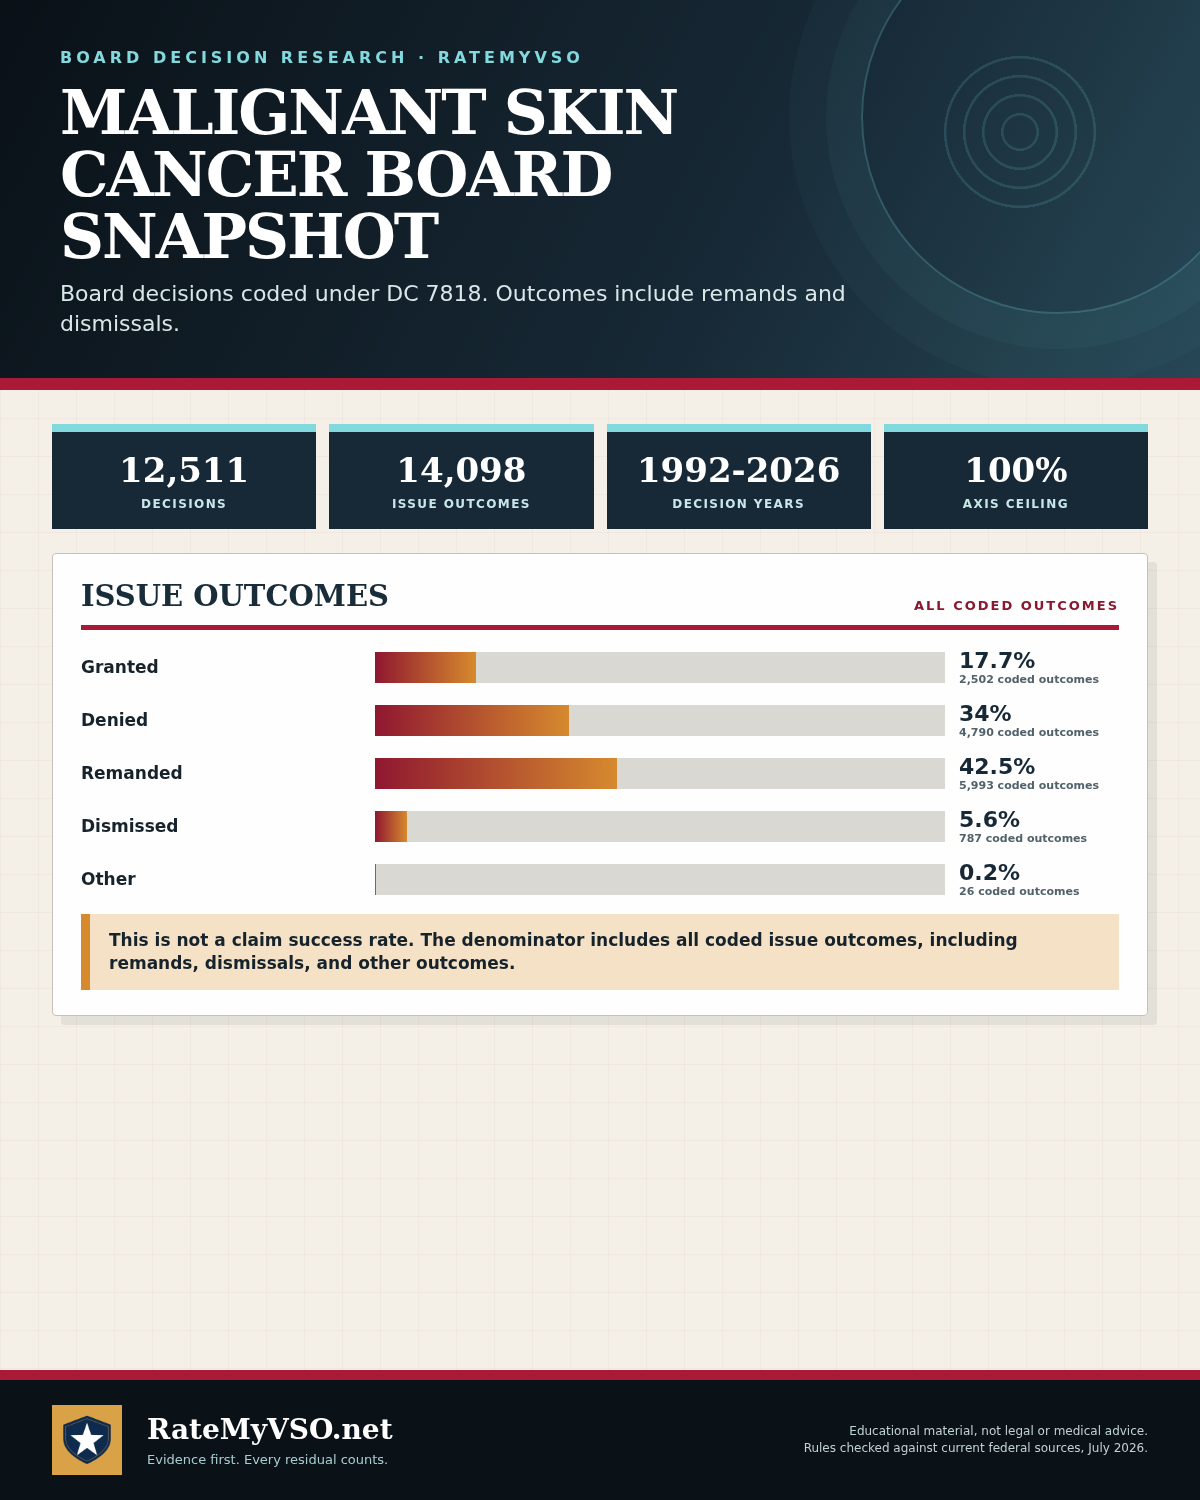
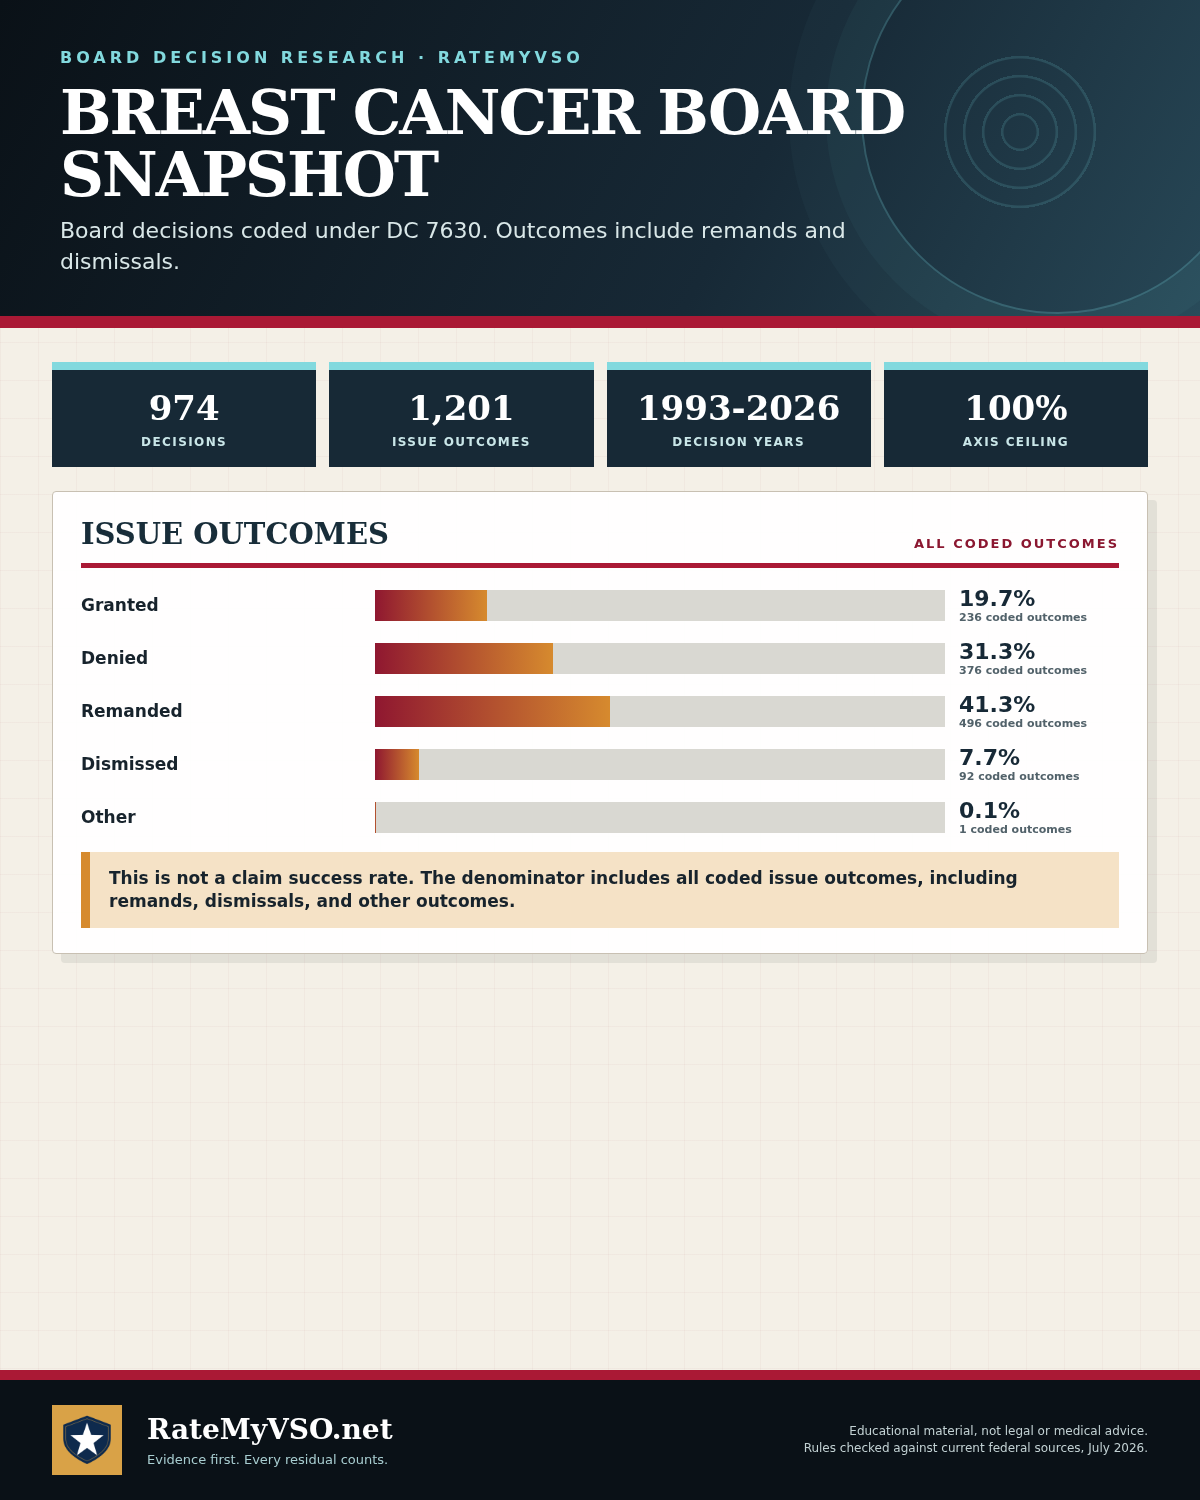
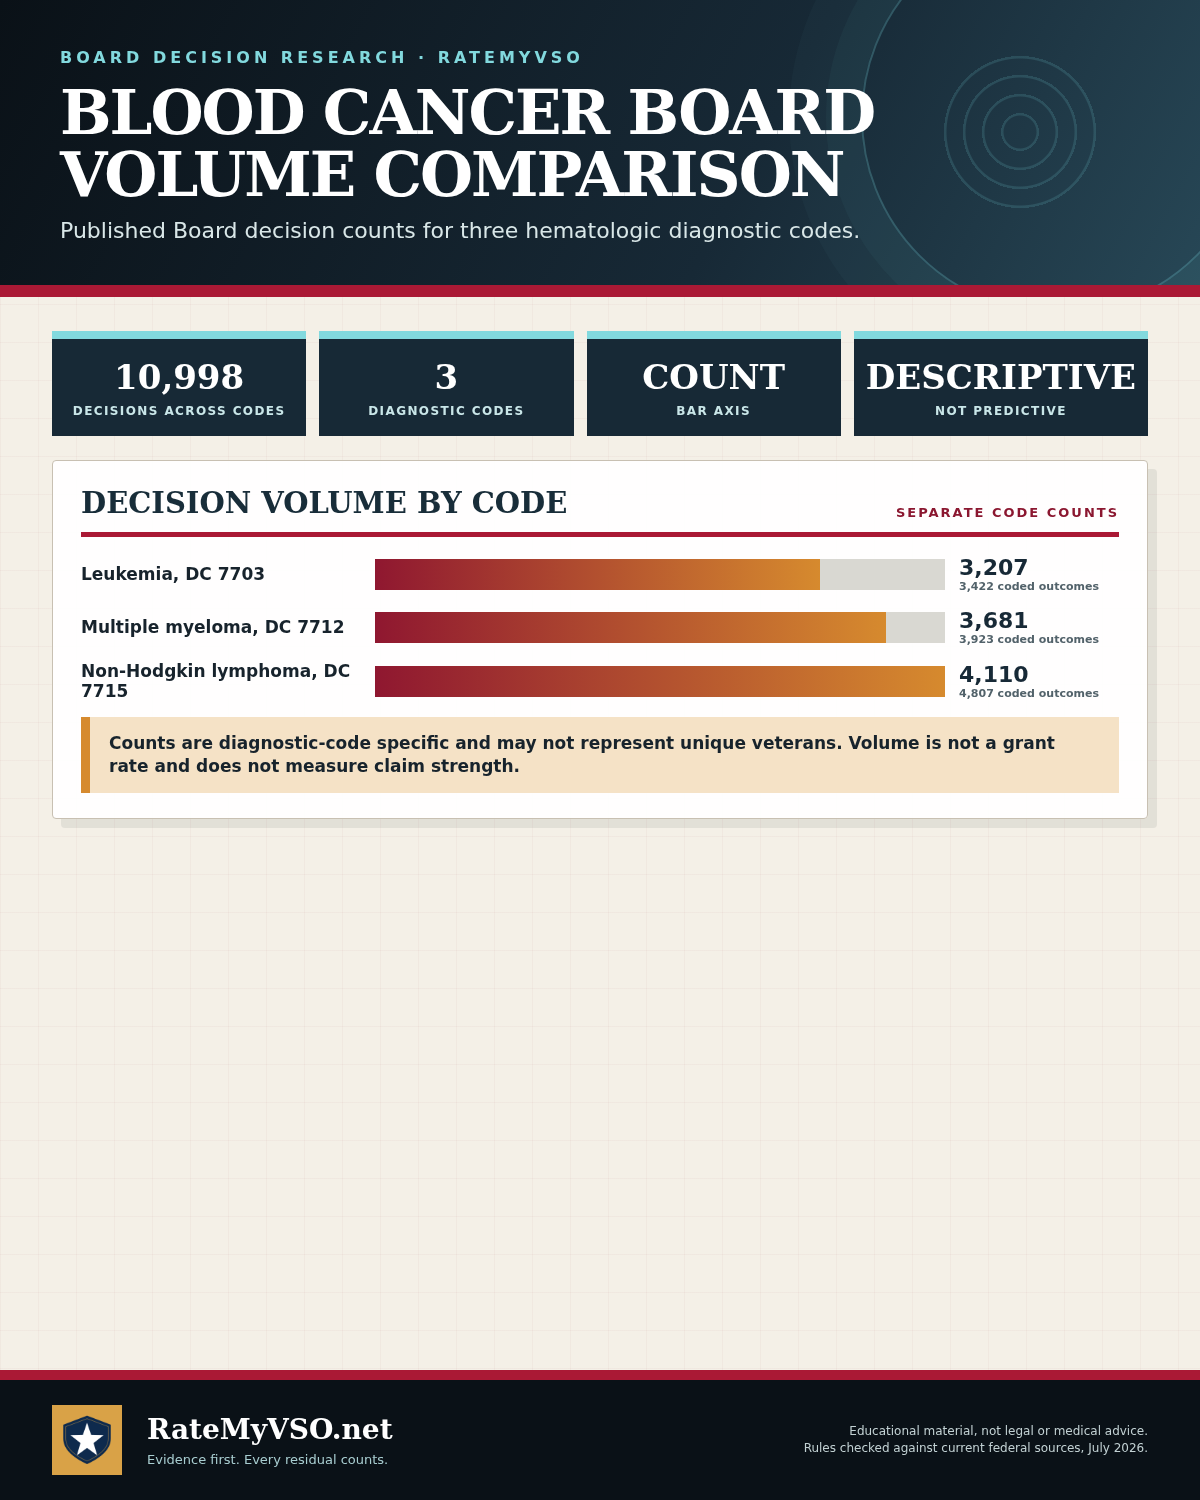
24 printable one-page charts covering how VA cancer claims work end to end: the presumptive pathways under the PACT Act, Agent Orange, Camp Lejeune and ionizing radiation, what establishes active disease and holds the 100 percent rating, the post-treatment window that each diagnostic code sets for itself, the mandatory review examination and how a reduction is supposed to work, the residual evidence that carries the rating once treatment ends, cancer-specific residuals for prostate, breast, respiratory and digestive cases, the treatment effects that show up regardless of cancer type, where special monthly compensation and unemployability fit, and research on the outcomes recorded in published Board decisions.
All 24 visual guides
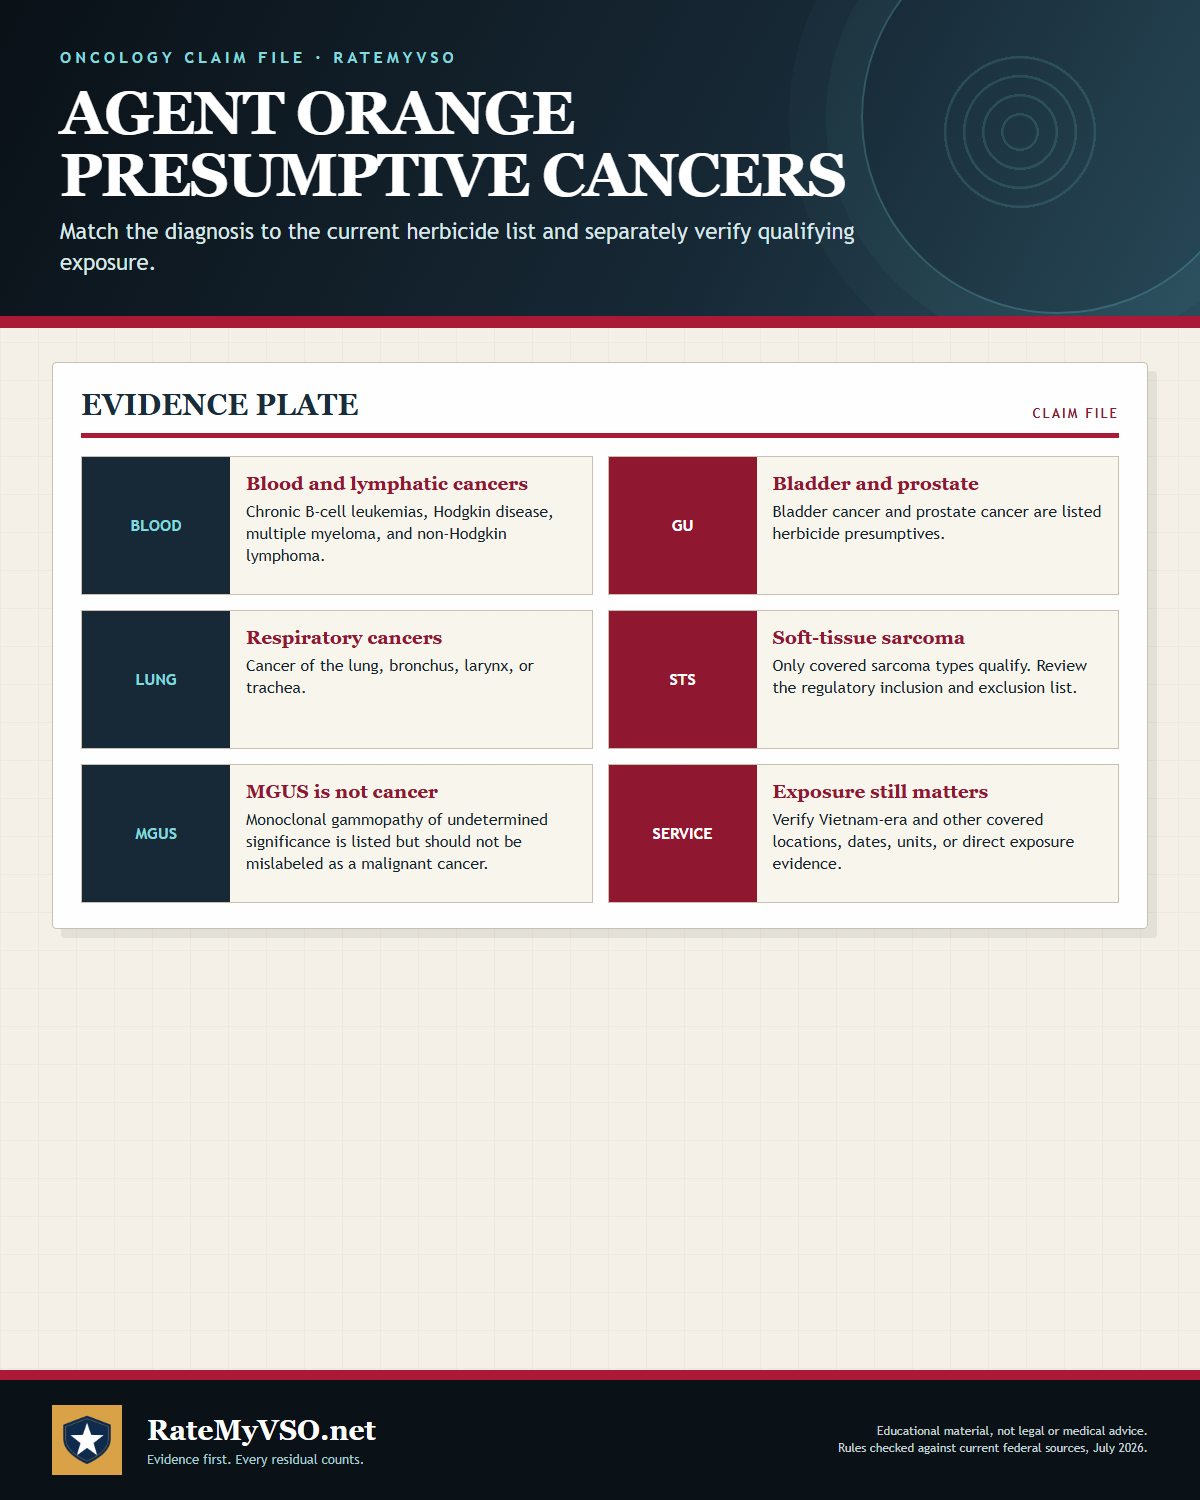
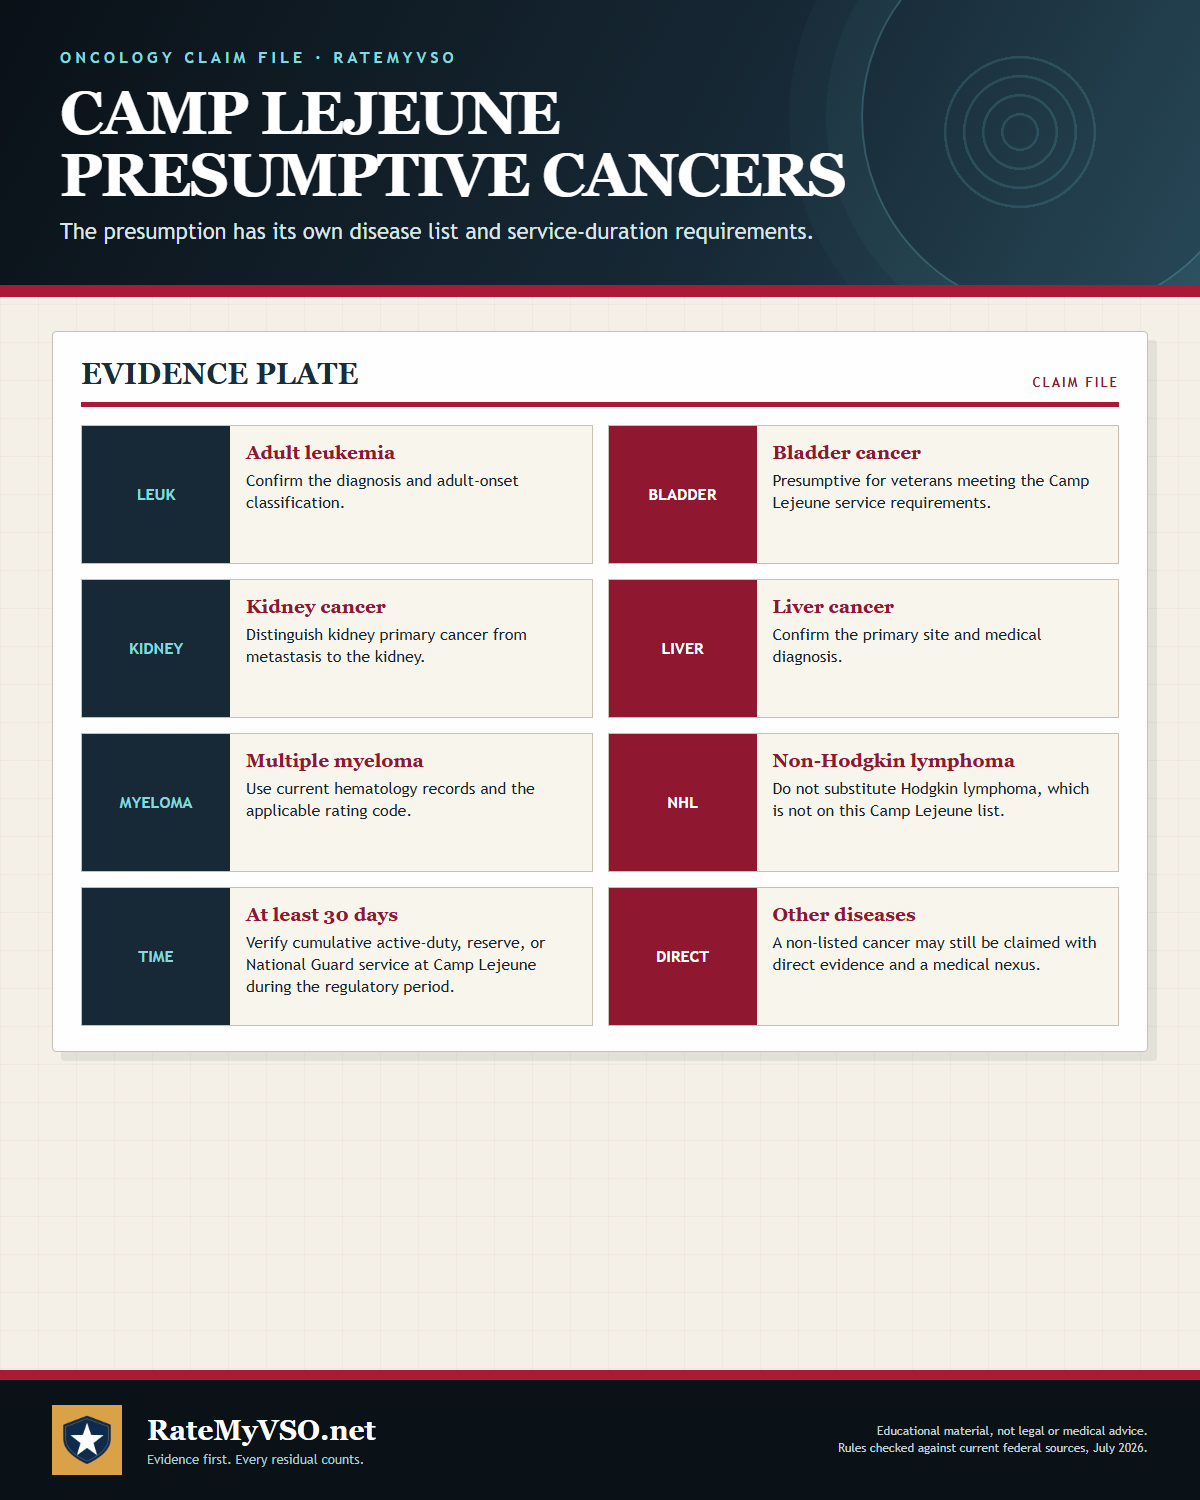
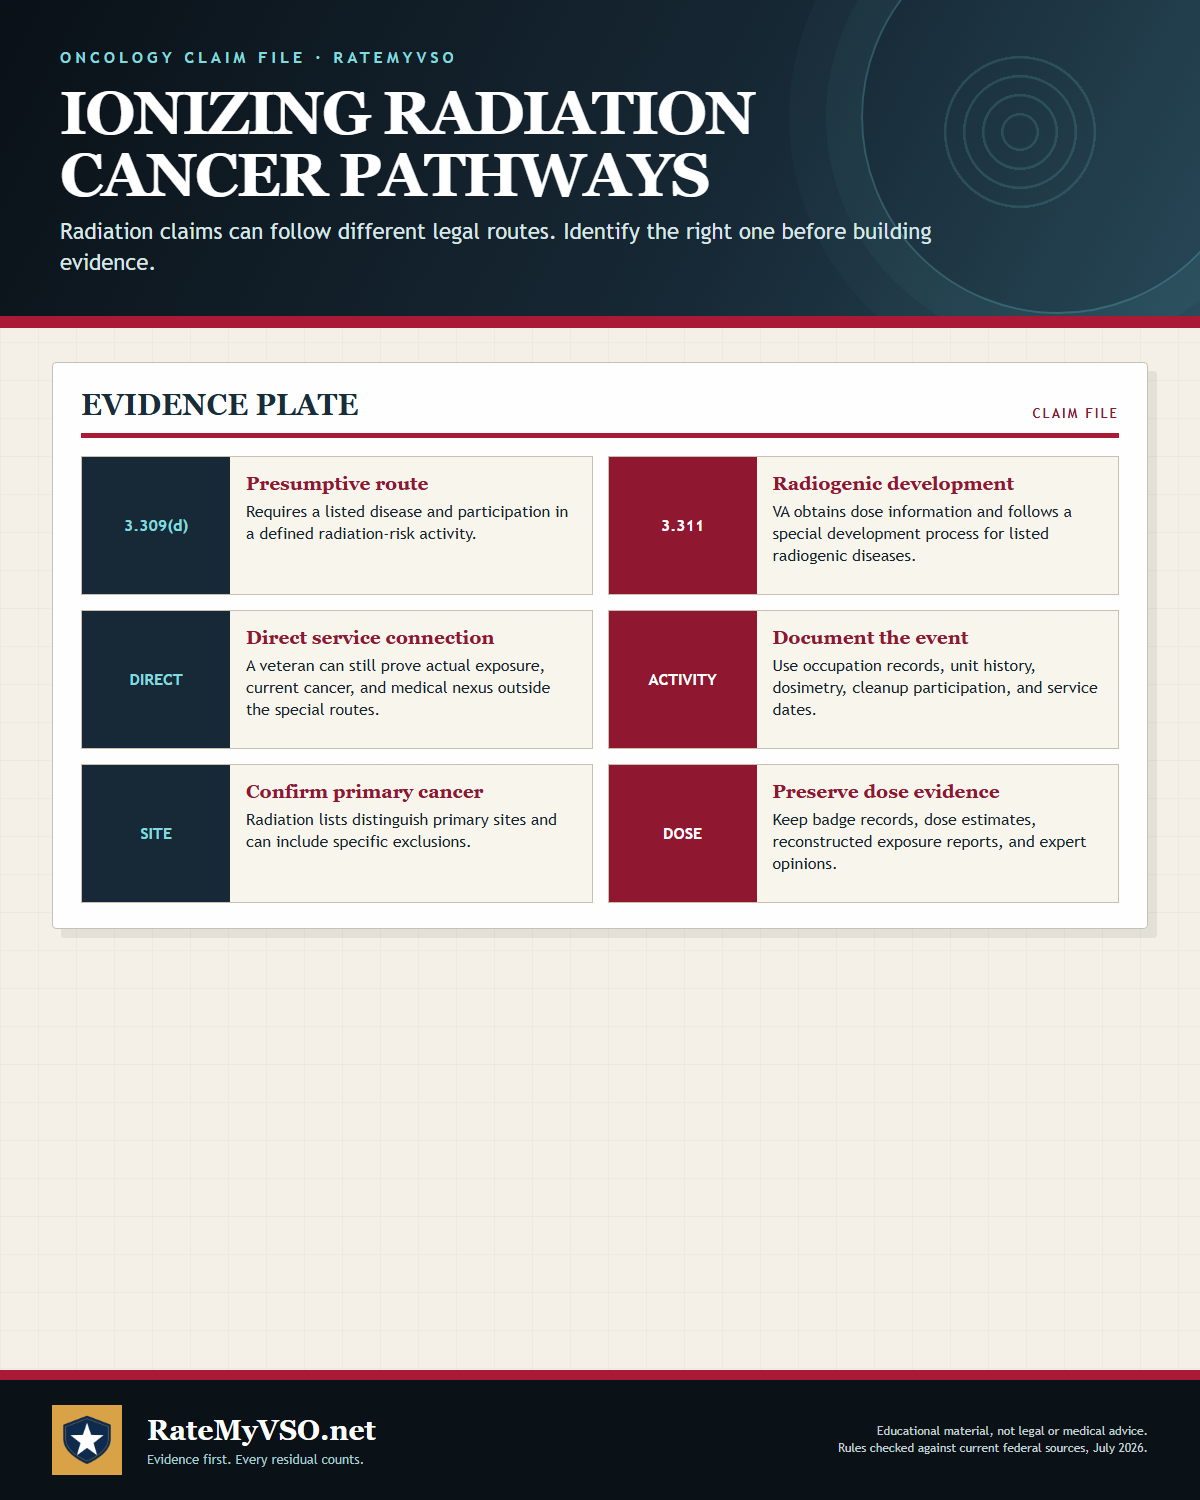
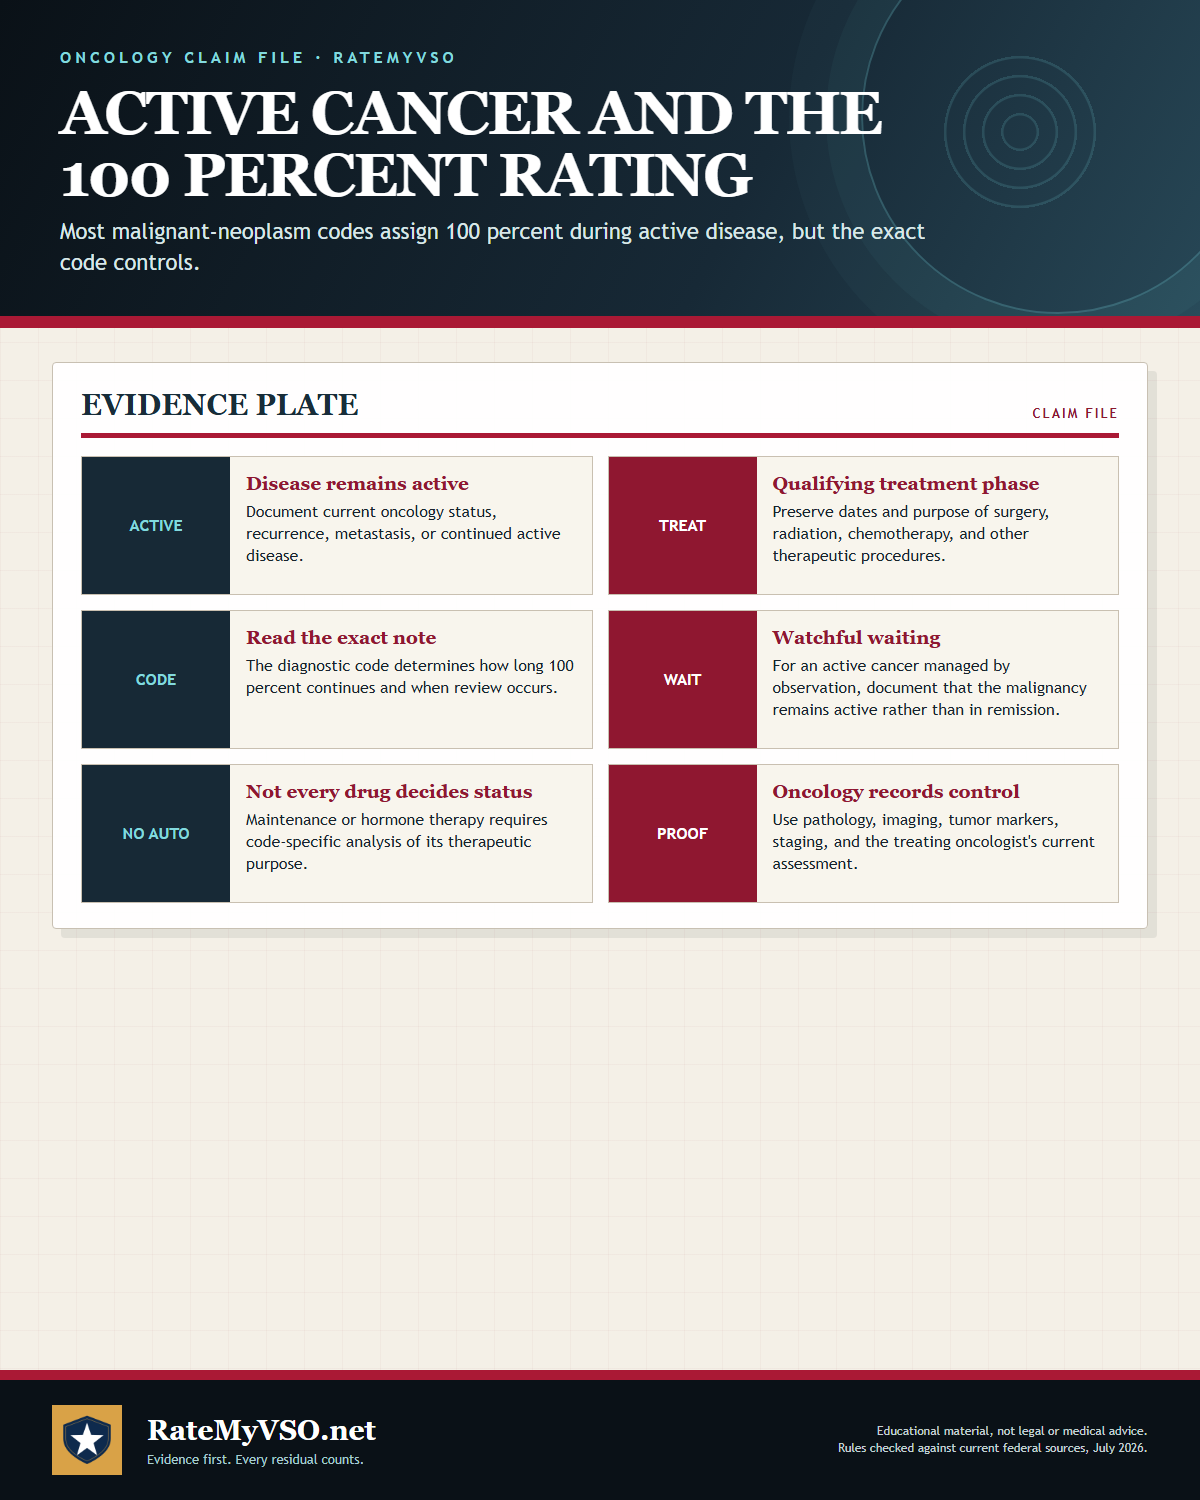
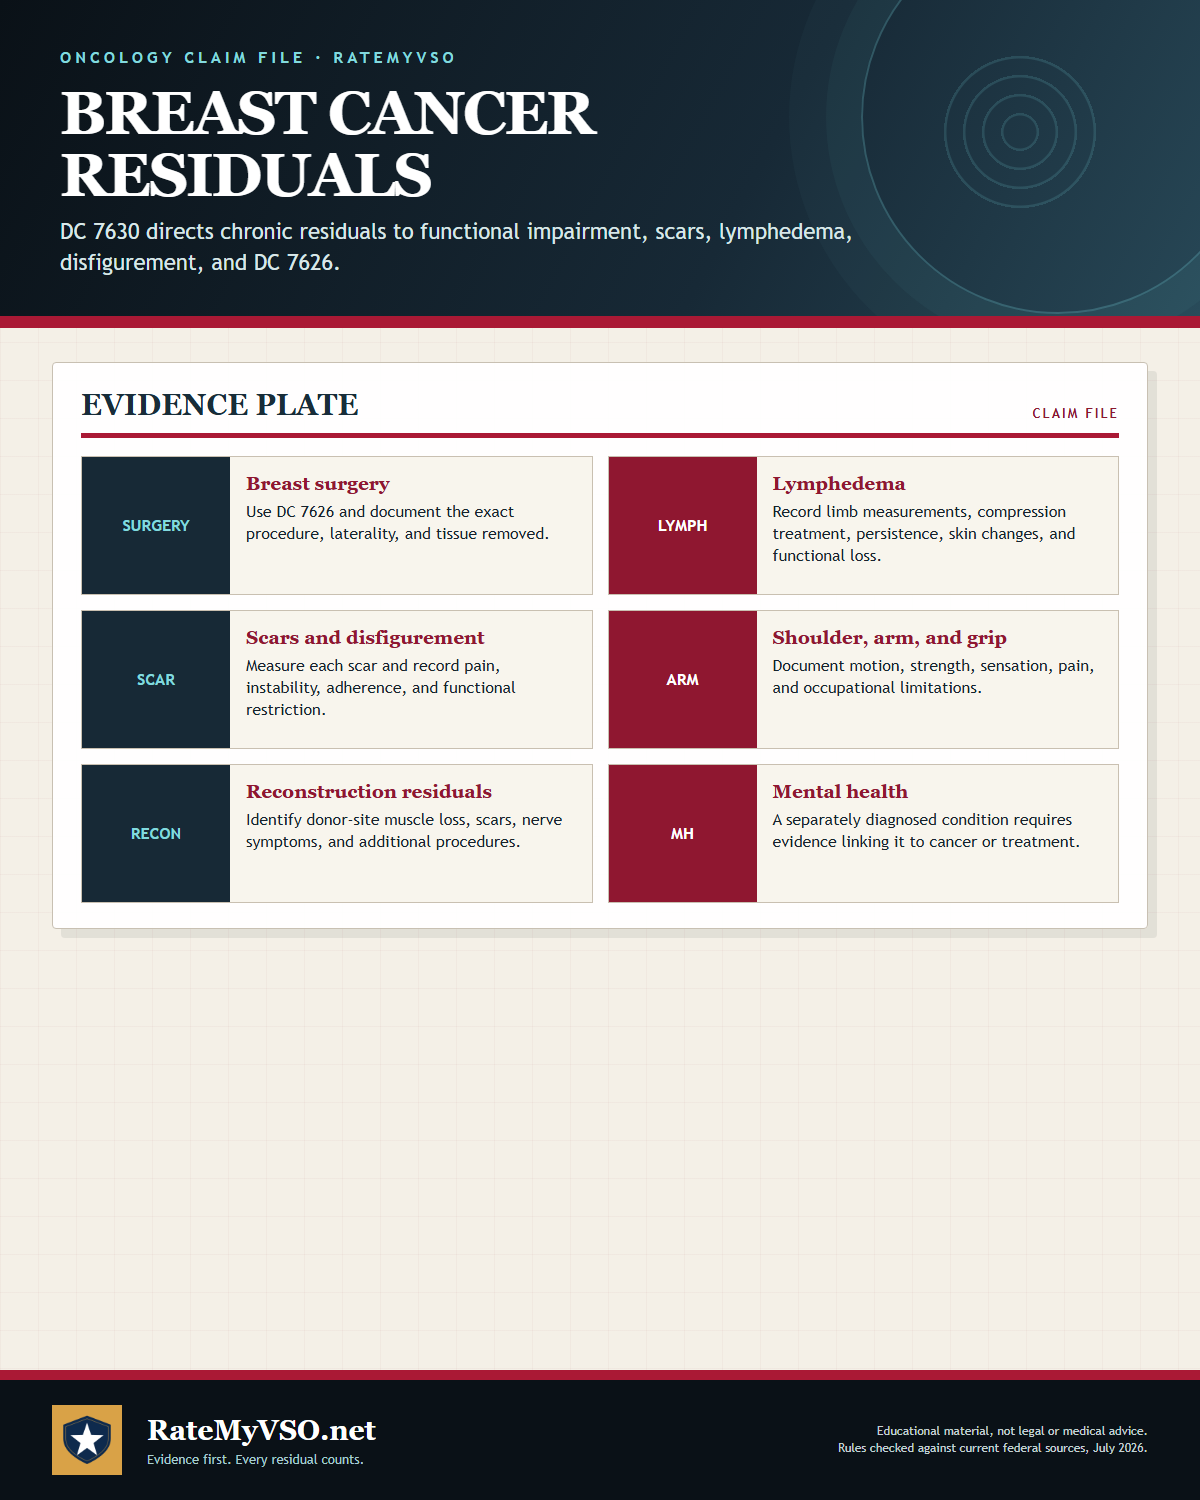
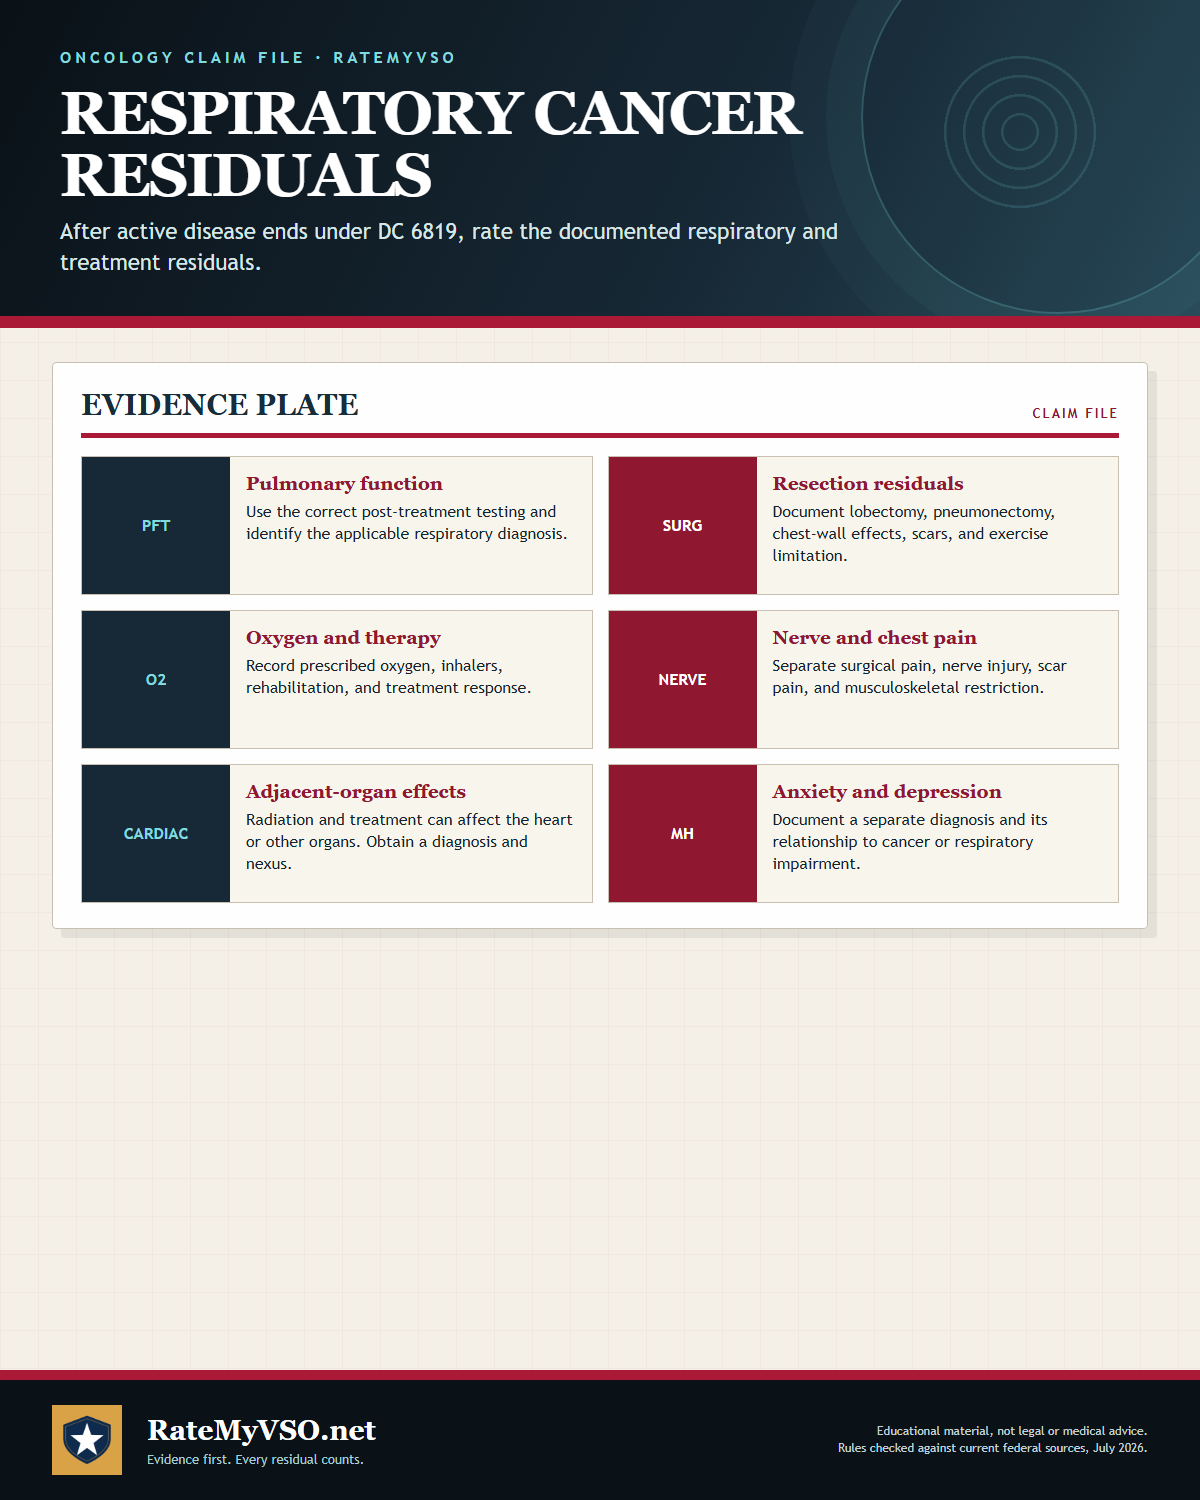
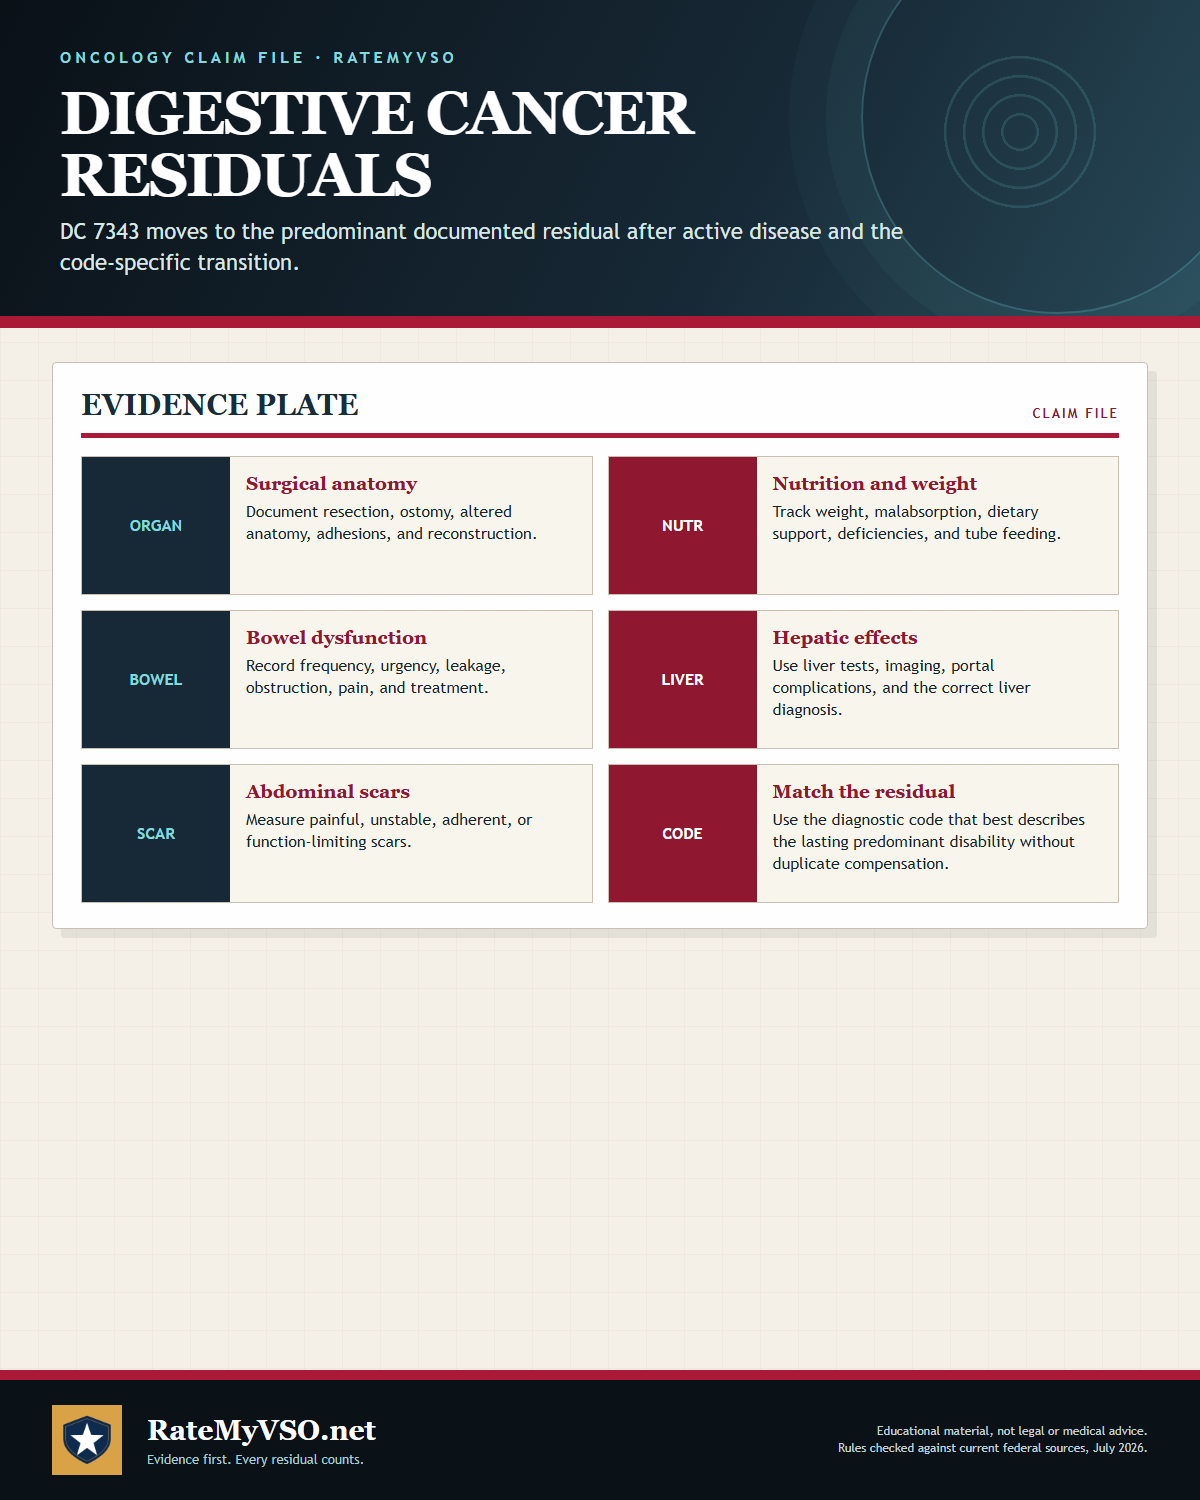
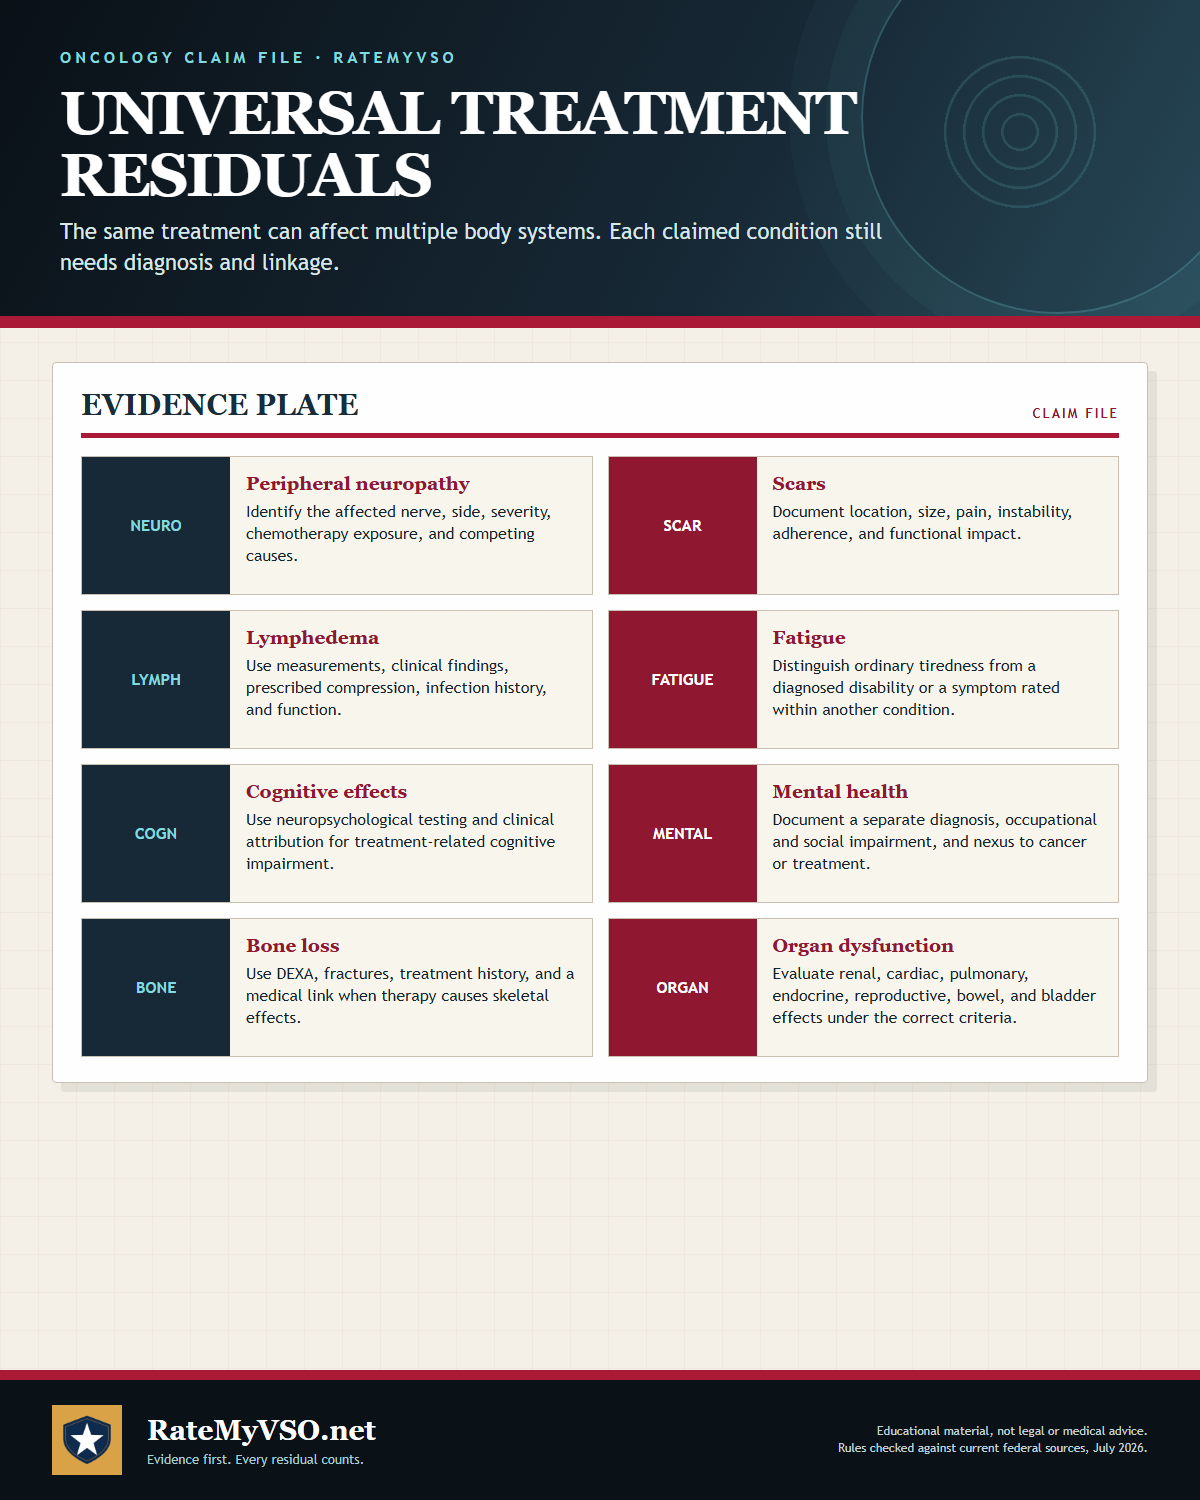
How to use this library
Every guide is a single tall image sized for printing or saving to your phone. Select any card to open the full-resolution image, or use the download link under it. Use the filter to narrow to one stage of the claim. The presumptive and rating charts summarize the published rules; the research charts report what RateMyVSO measured in published Board decisions, with the denominator printed on the chart itself.
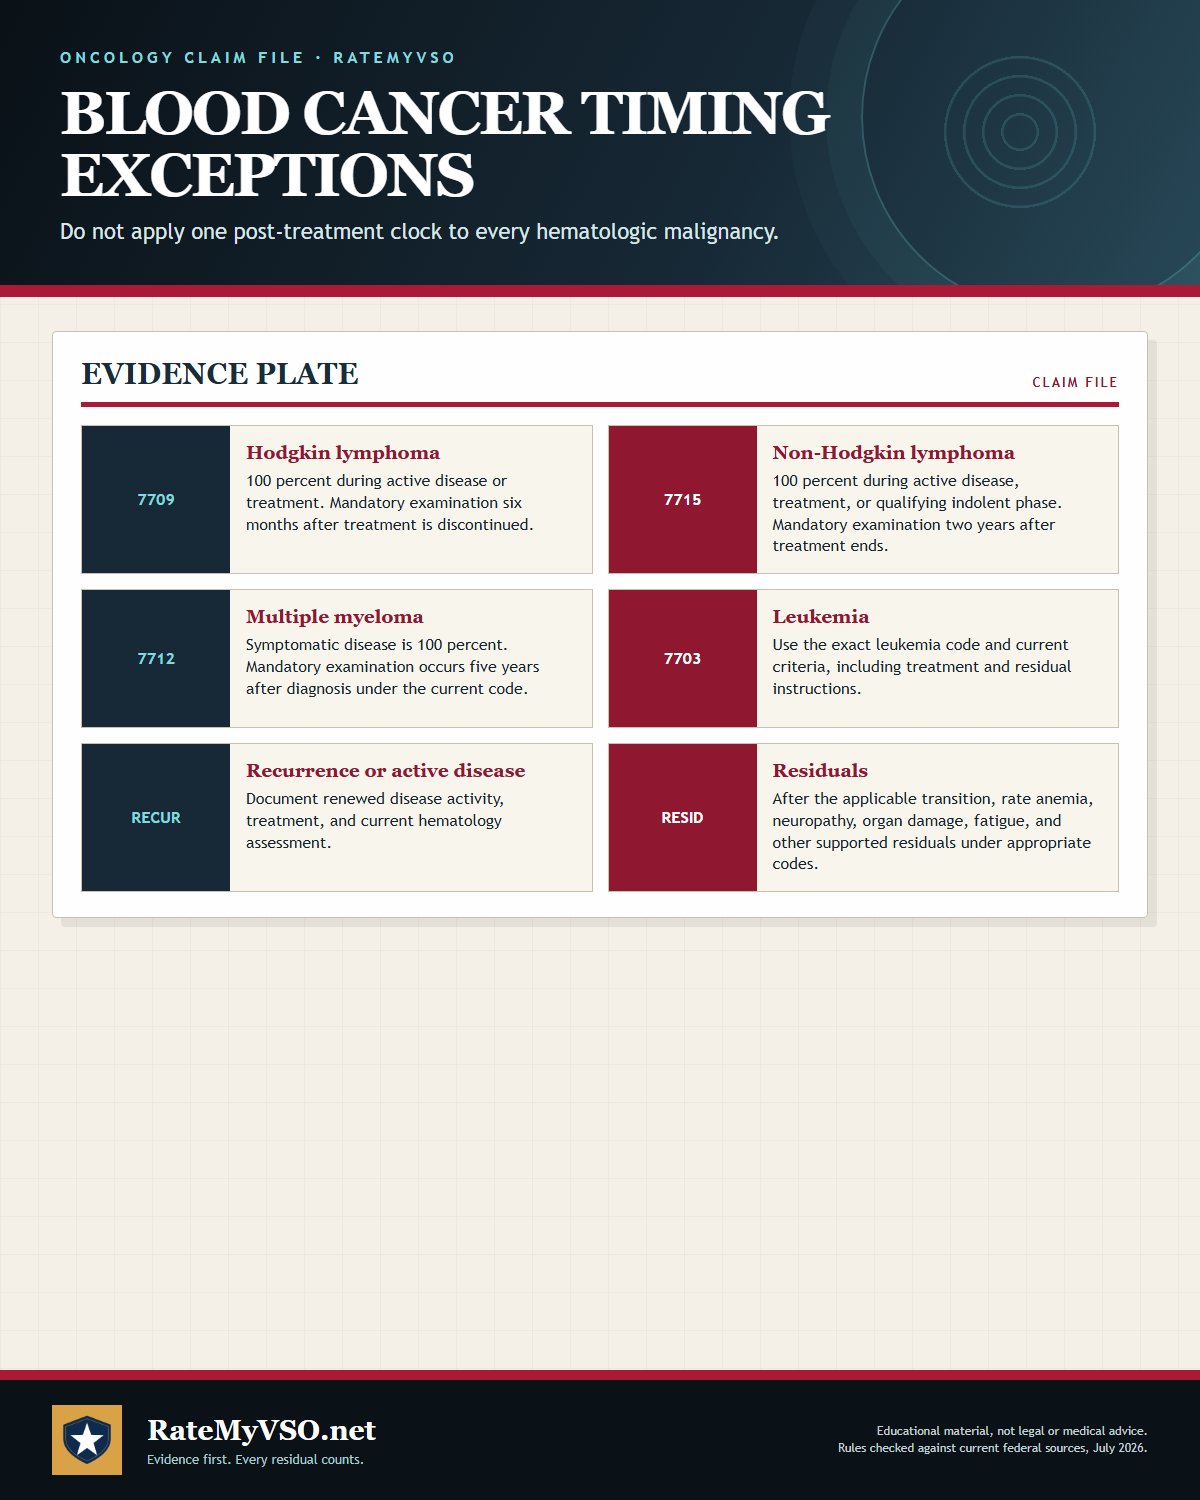
These charts catalogue the published rules and what appears in published Board decisions. Service connection, the active-cancer rating, the post-treatment transition, and residual ratings are kept separate throughout, because they are four different questions decided at four different times. The post-treatment window is set by each diagnostic code and is not uniform: six months is the common rule, but non-Hodgkin lymphoma runs two years and multiple myeloma runs five years from the diagnosis of symptomatic disease. Each research chart names one diagnostic code and its own denominator; the five outcome snapshots are never pooled into a figure for cancer as a whole, and the blood-cancer chart compares decision counts across three codes, which is a count of decisions rather than of unique veterans. An outcome share includes remands and dismissals, so it is not a claim success rate and not a prediction about any individual claim. These charts are not legal or medical advice. For the full written guidance, start with the cancer claims guide.