GERD and Celiac Visual Guide Library
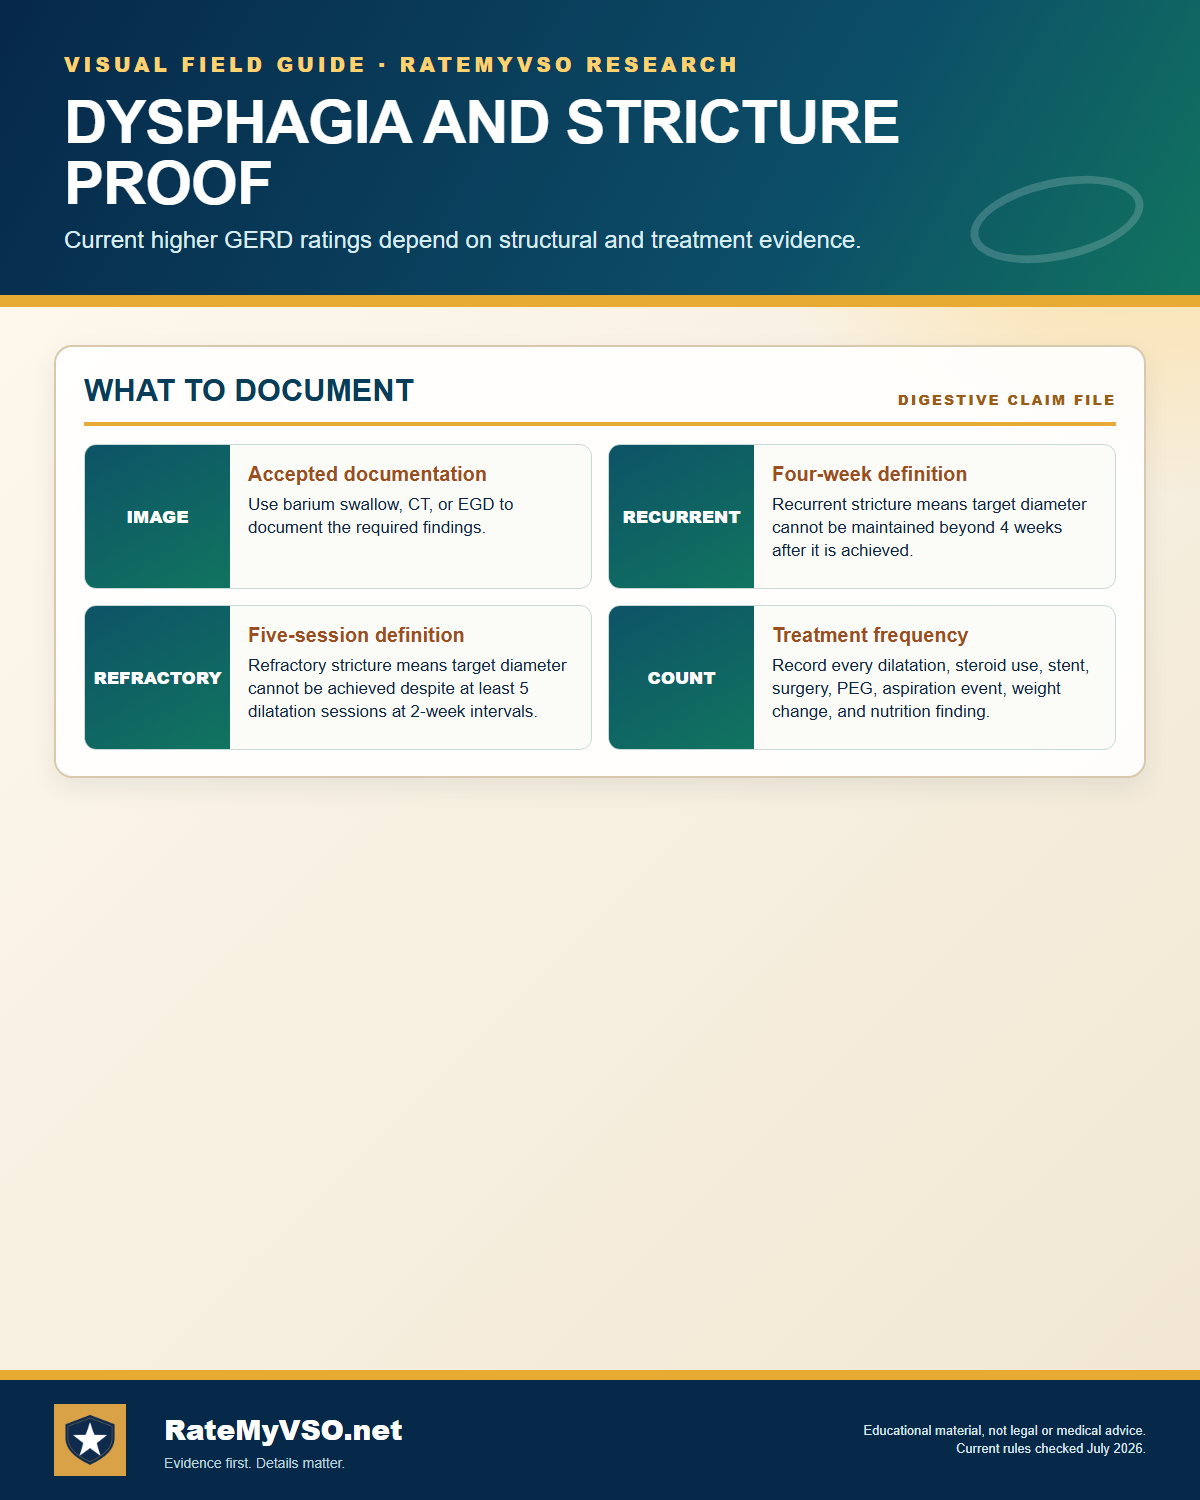
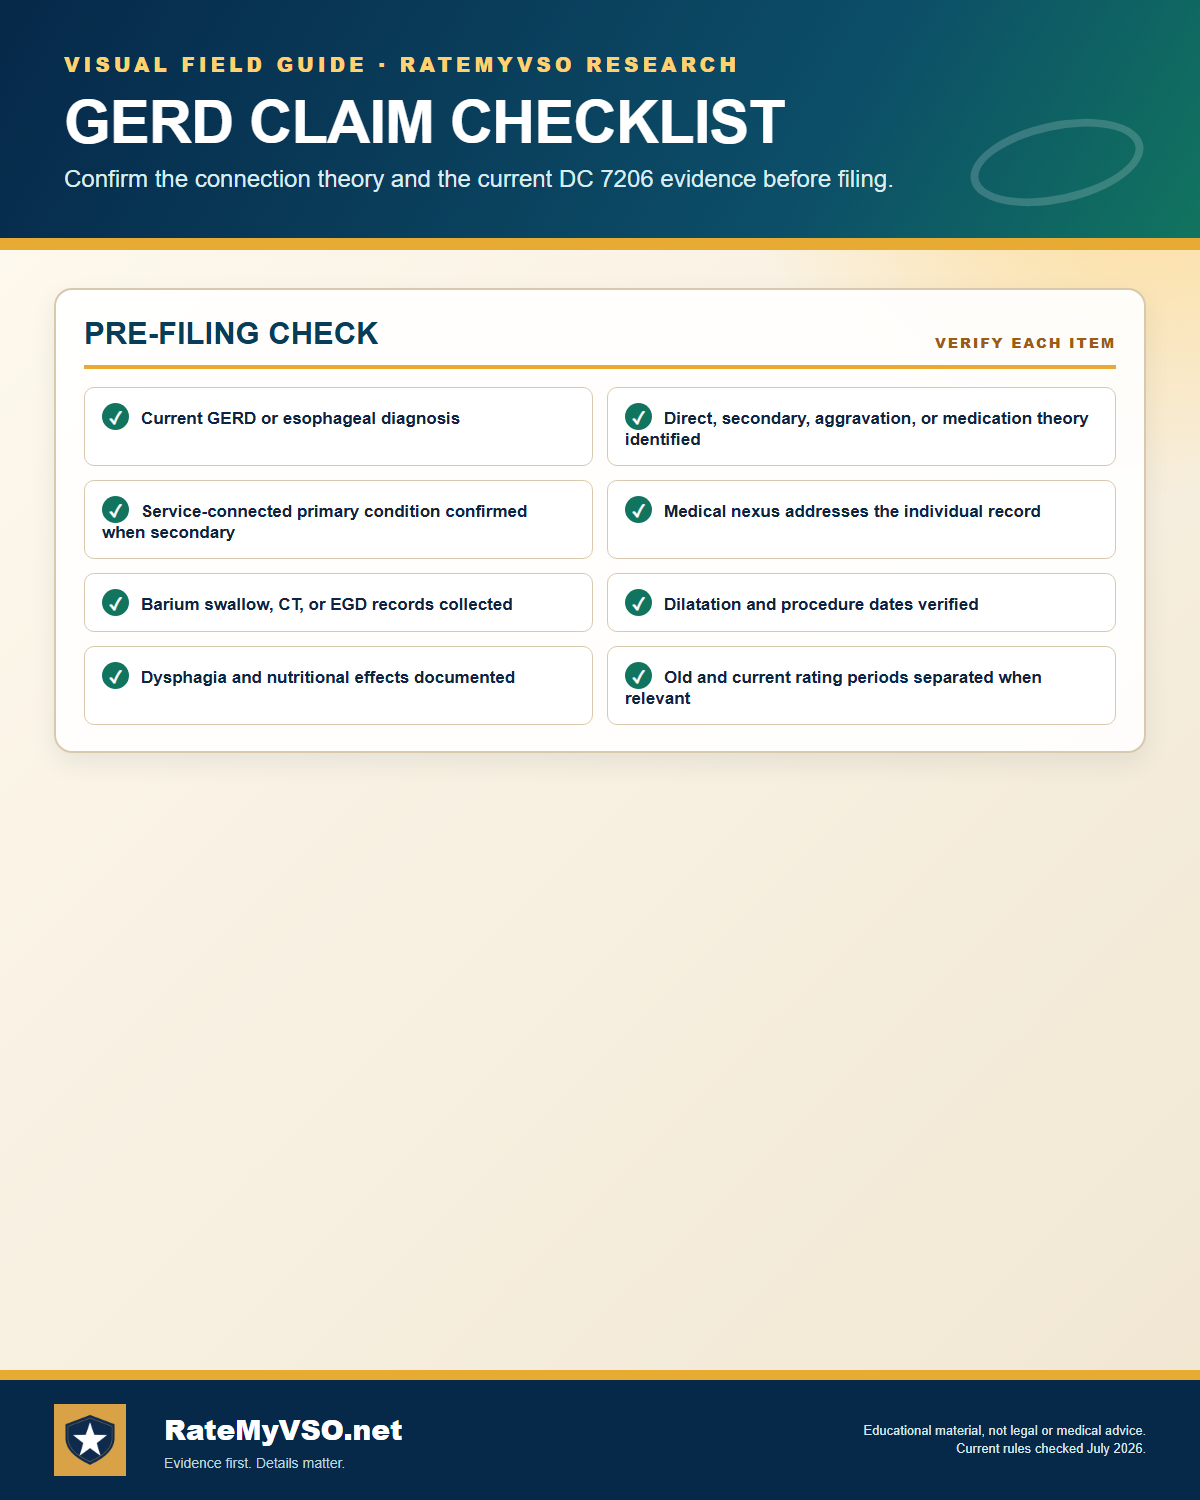
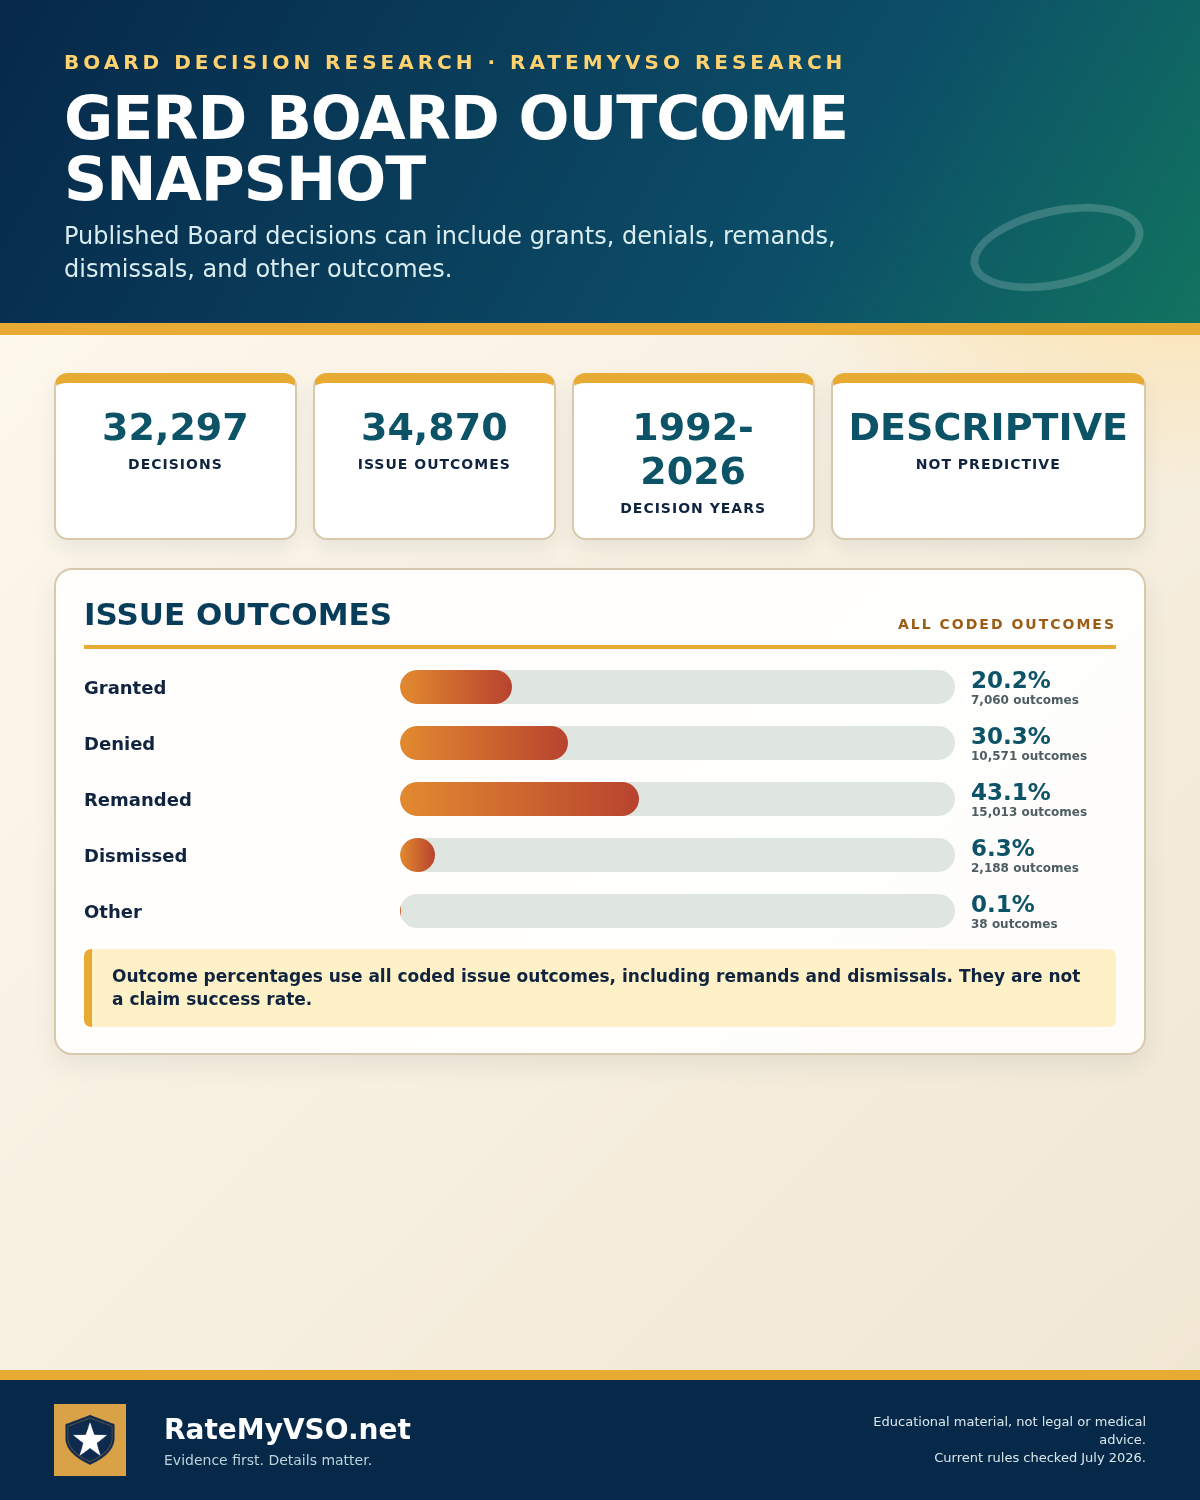
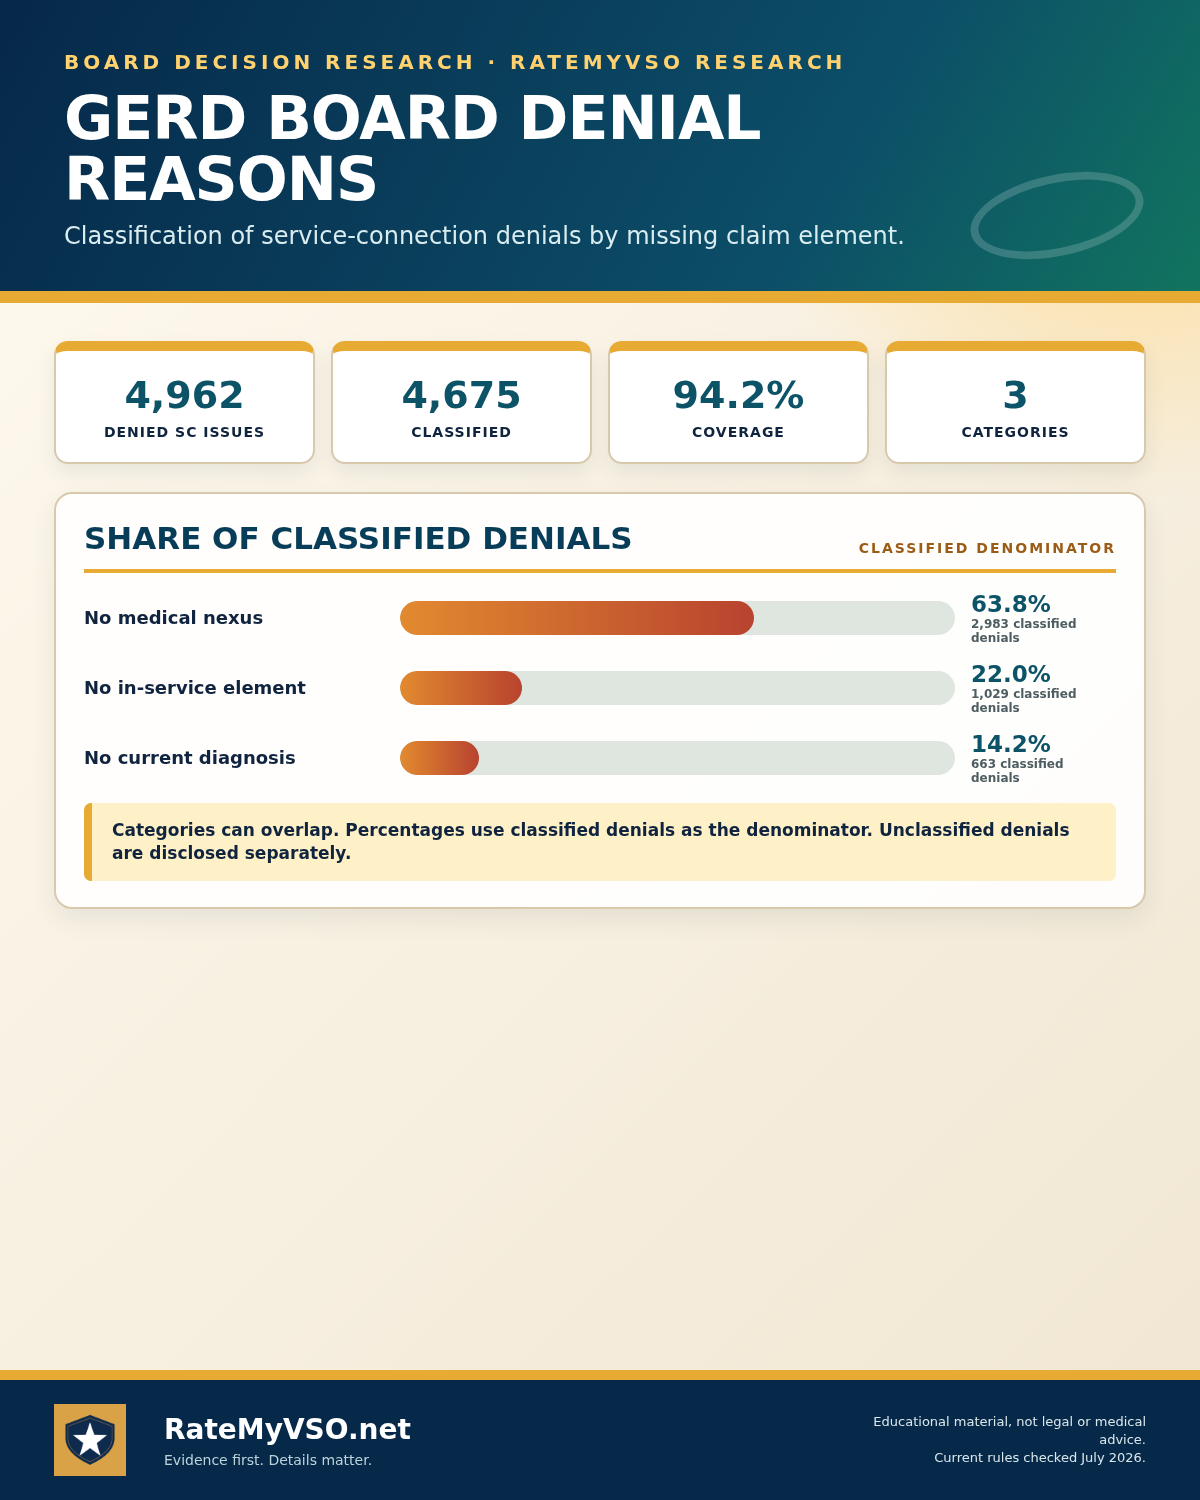
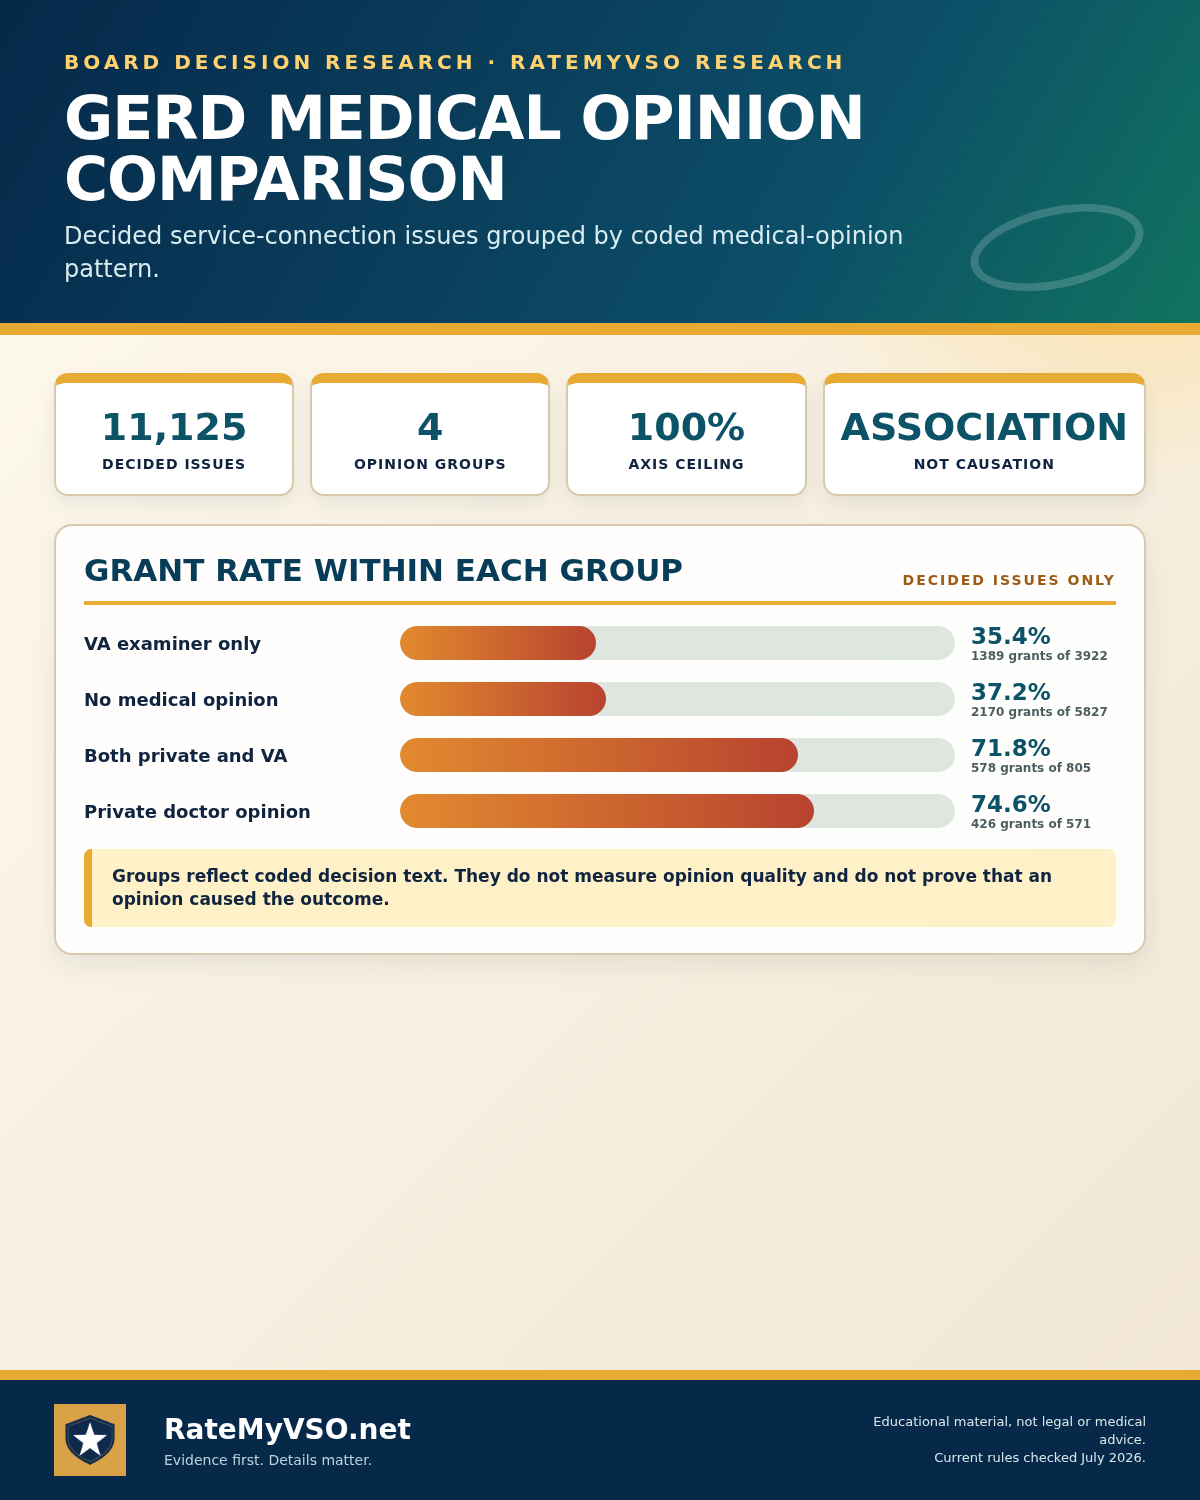
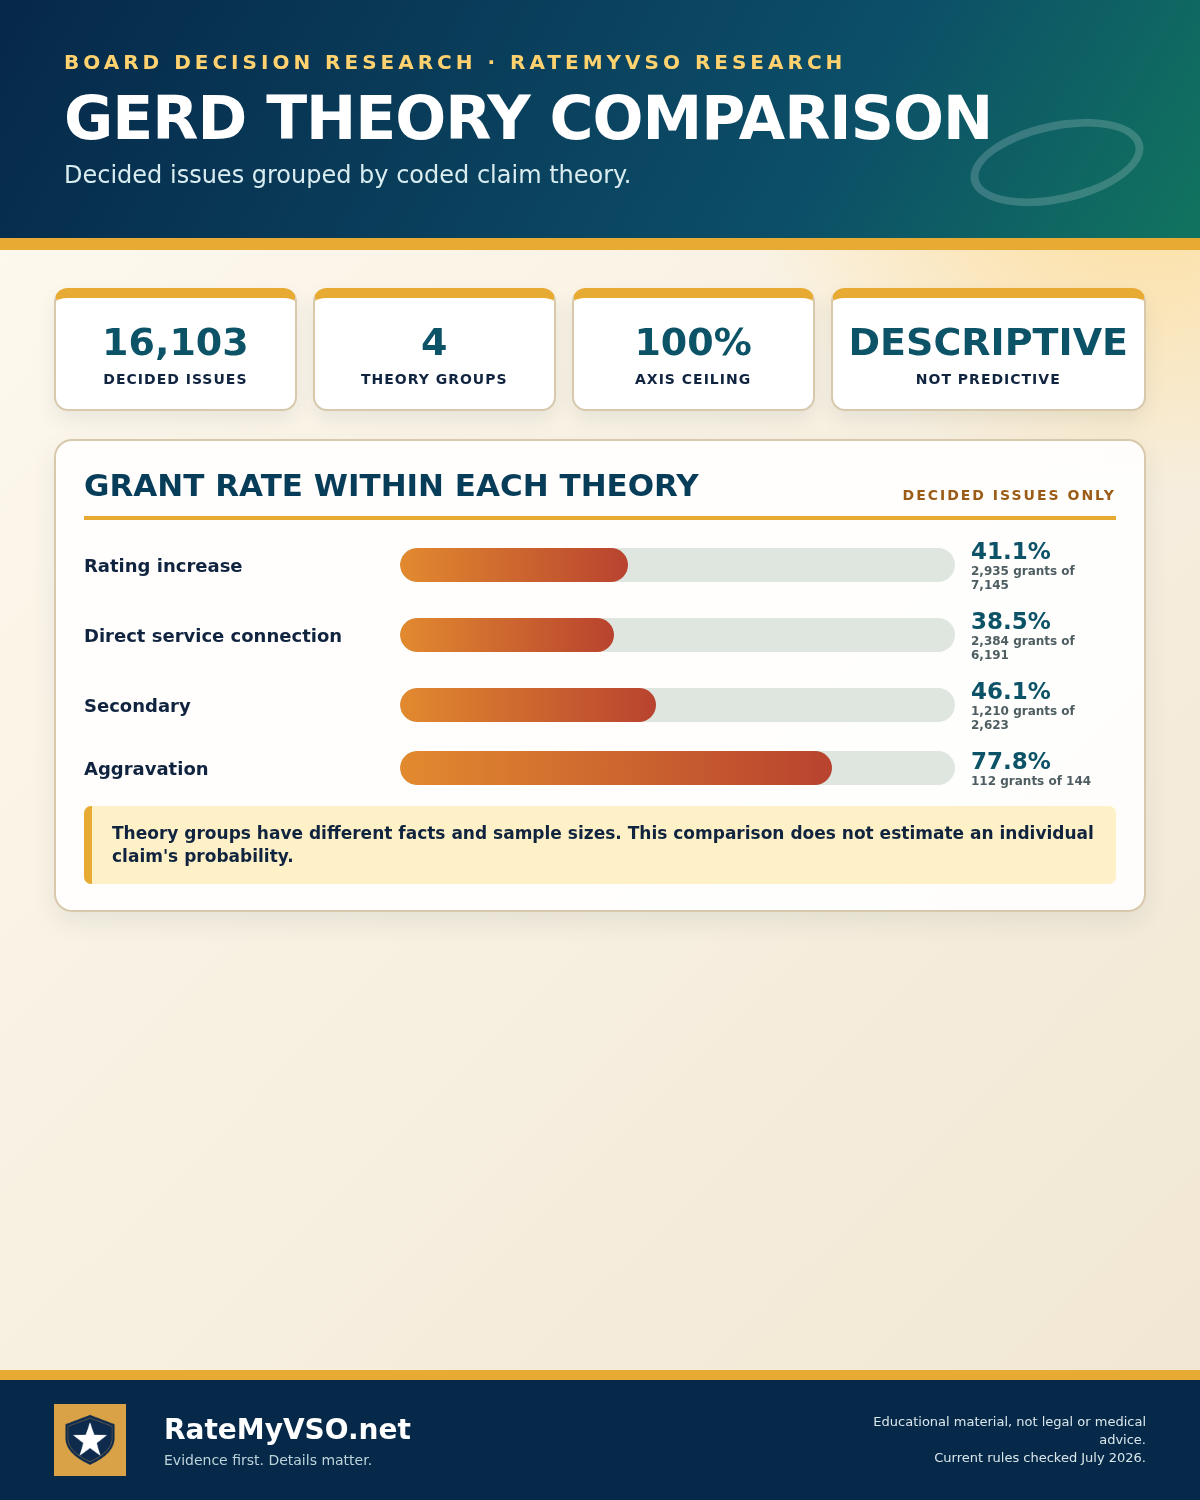
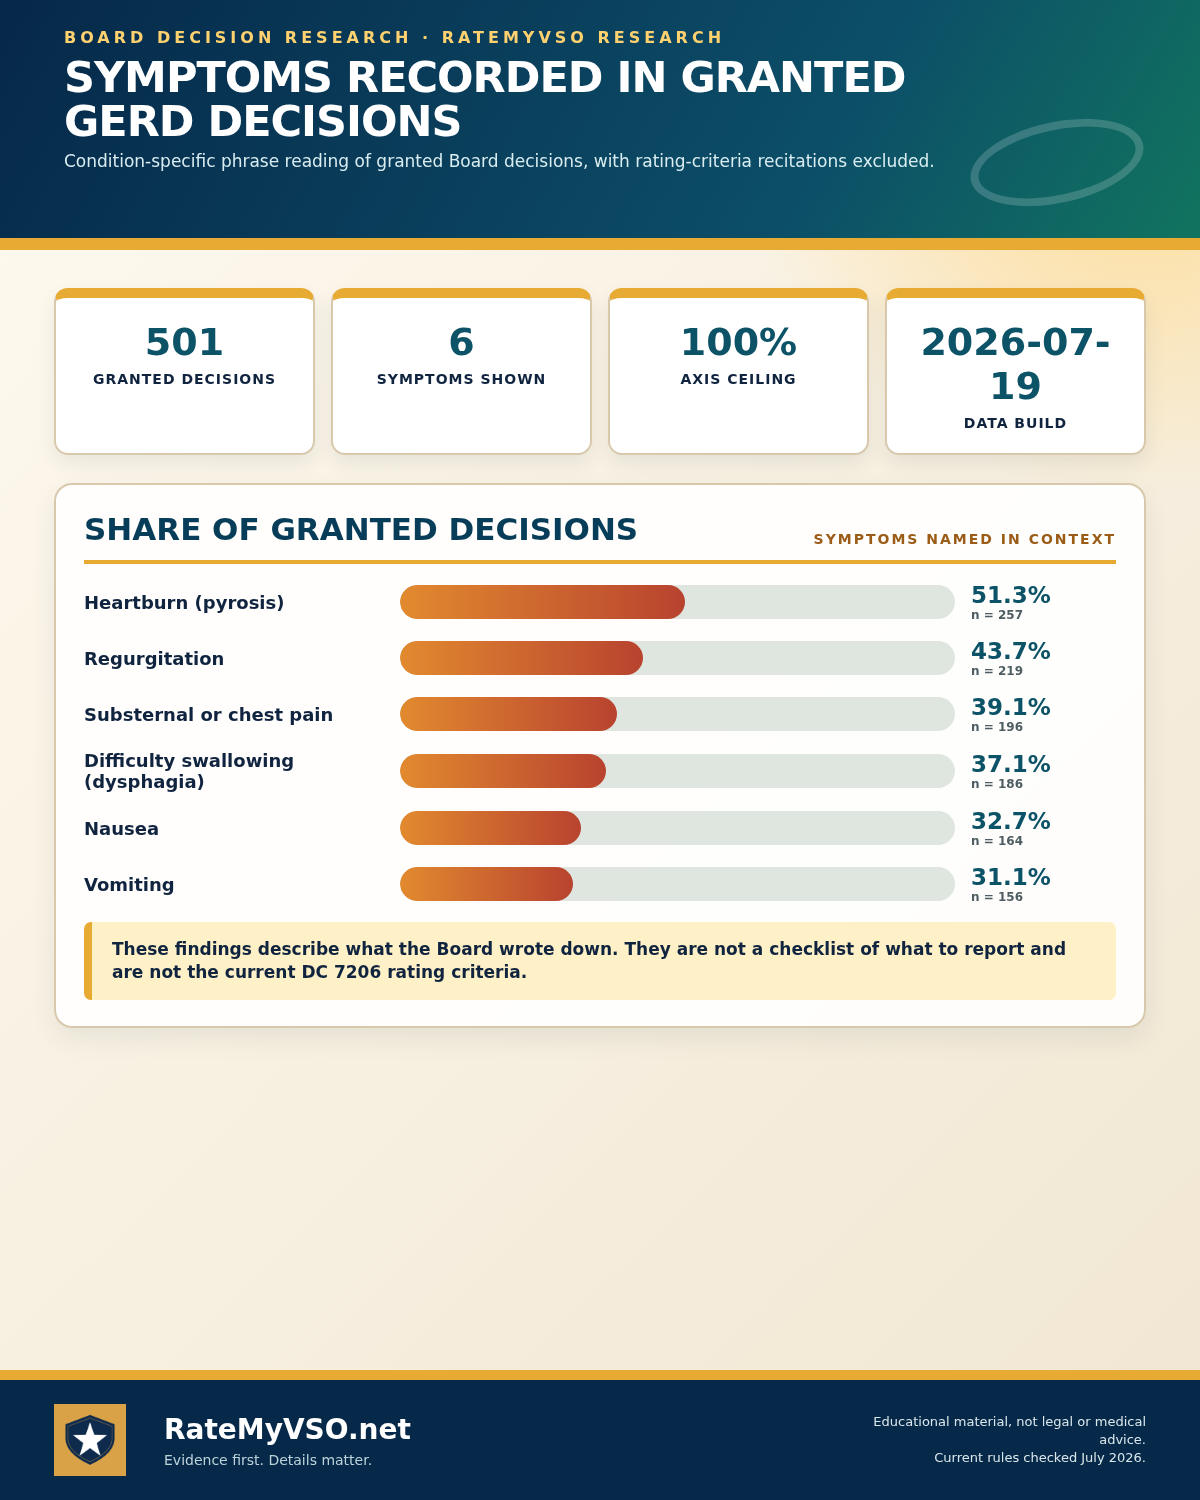
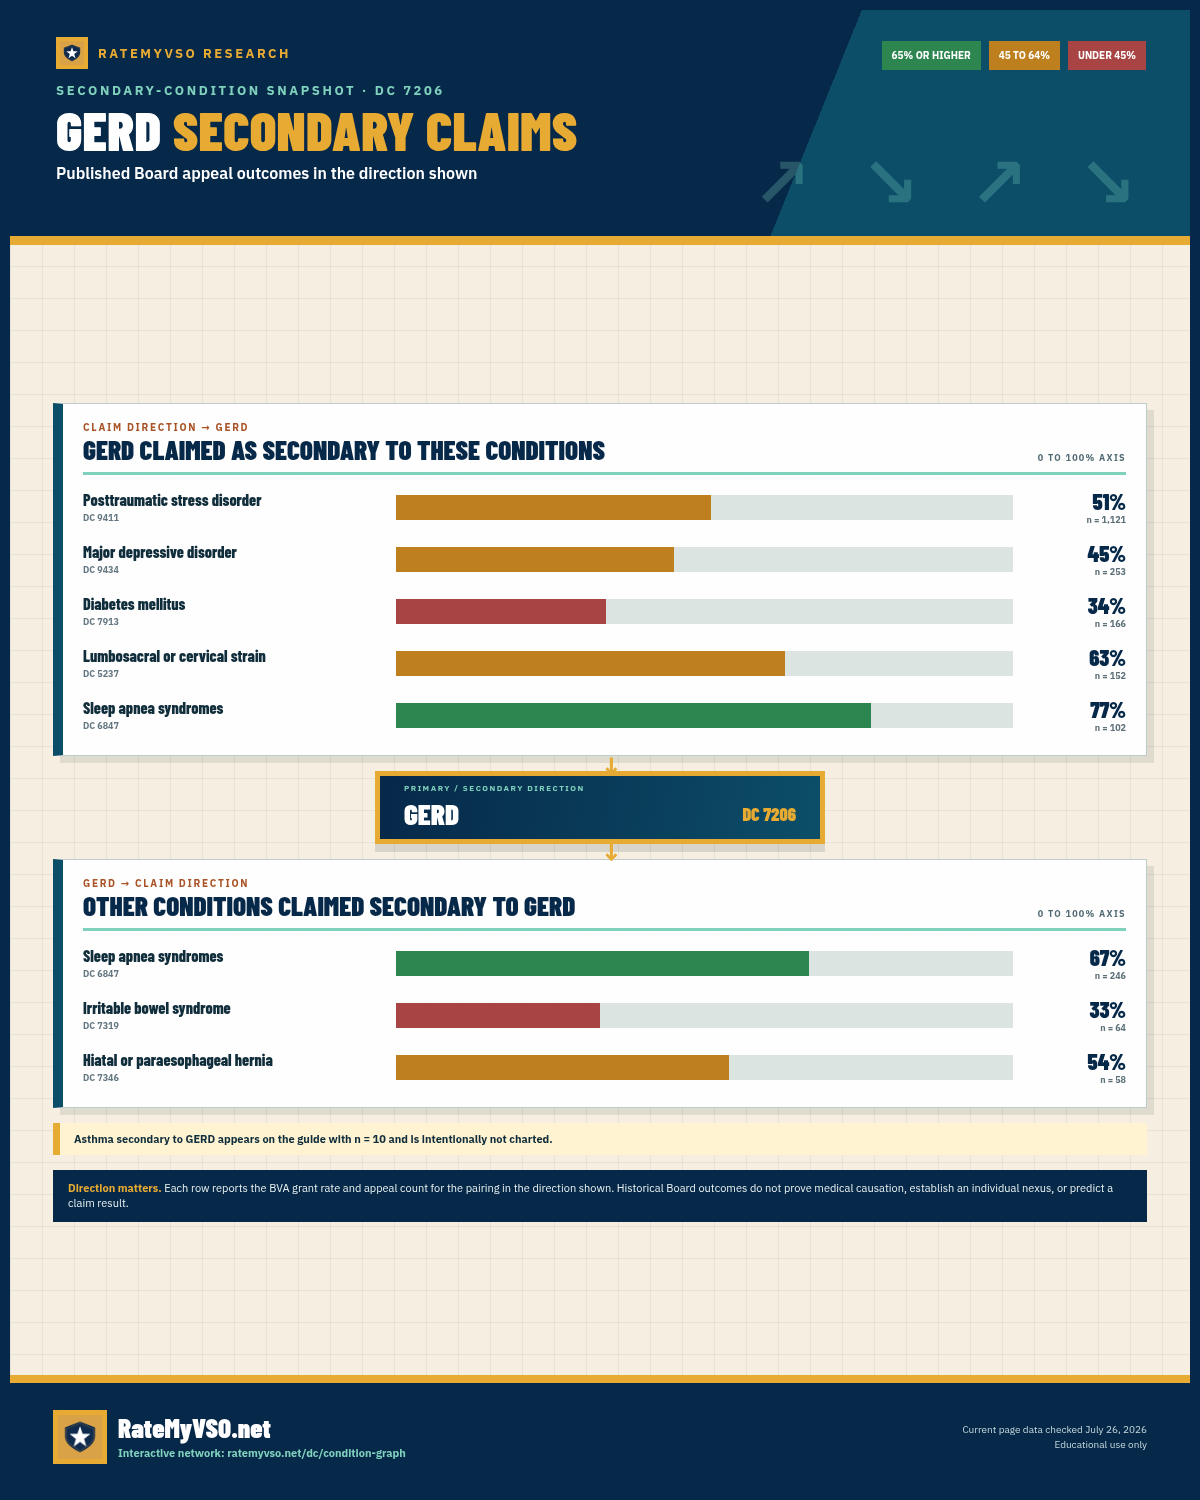
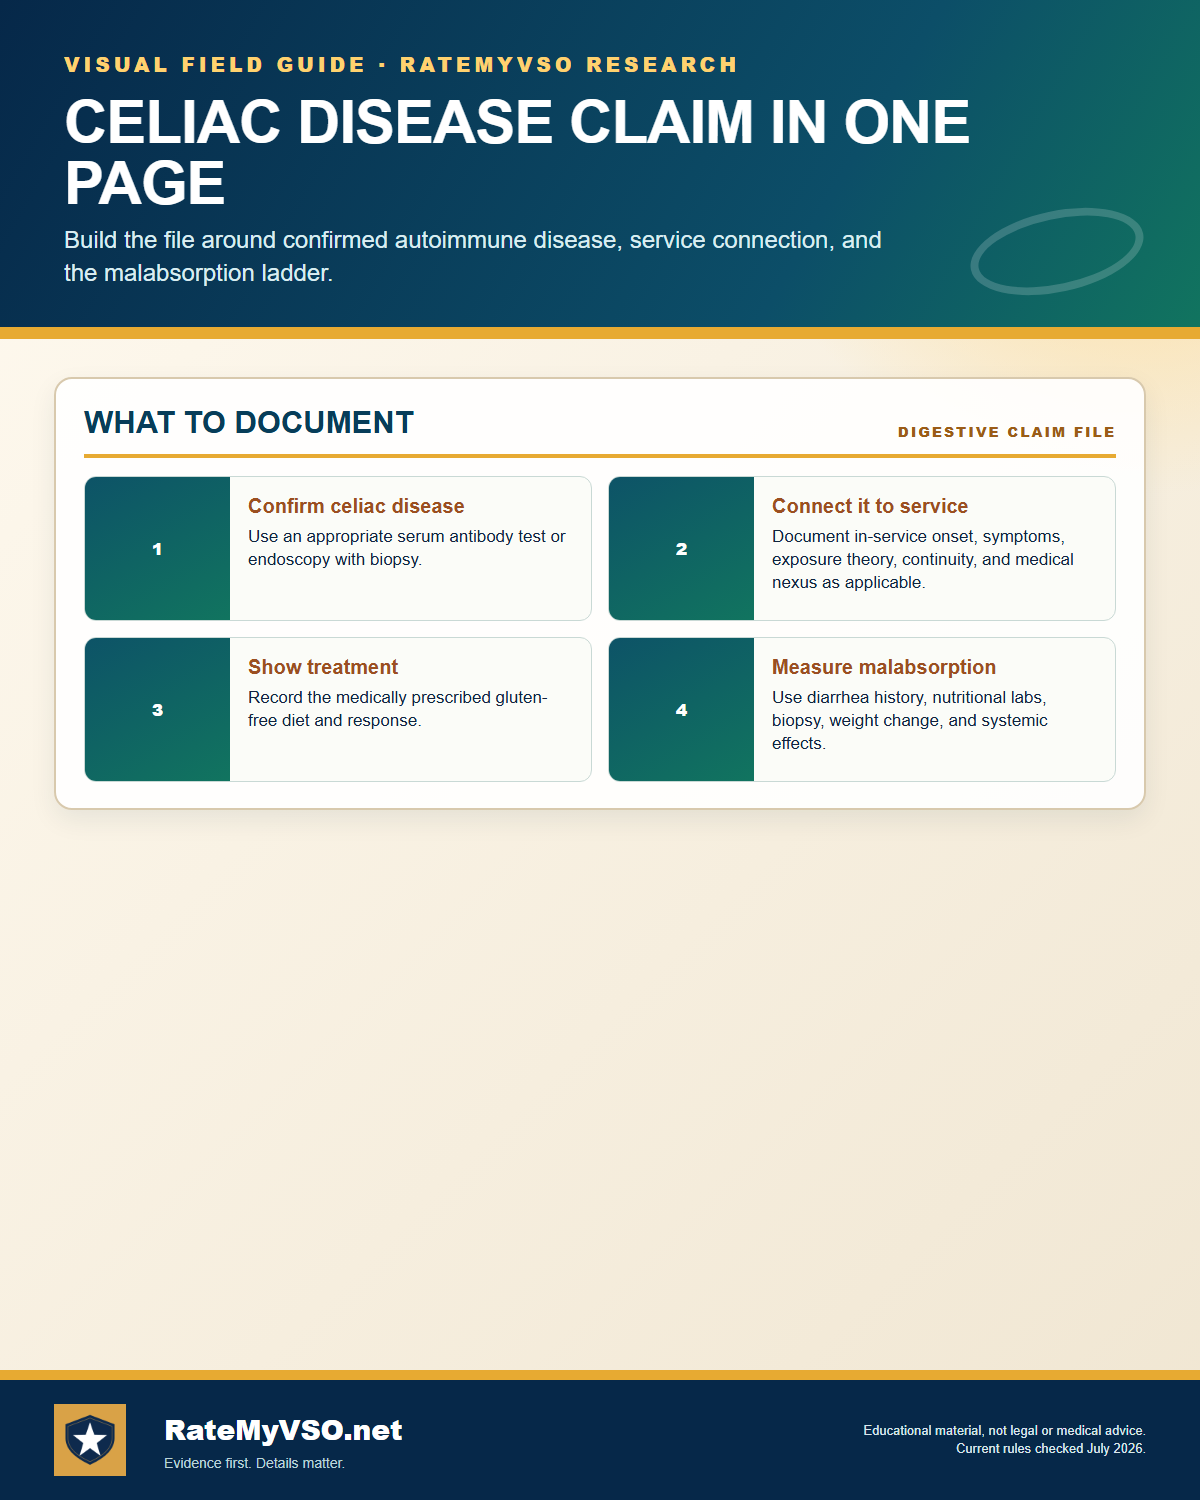
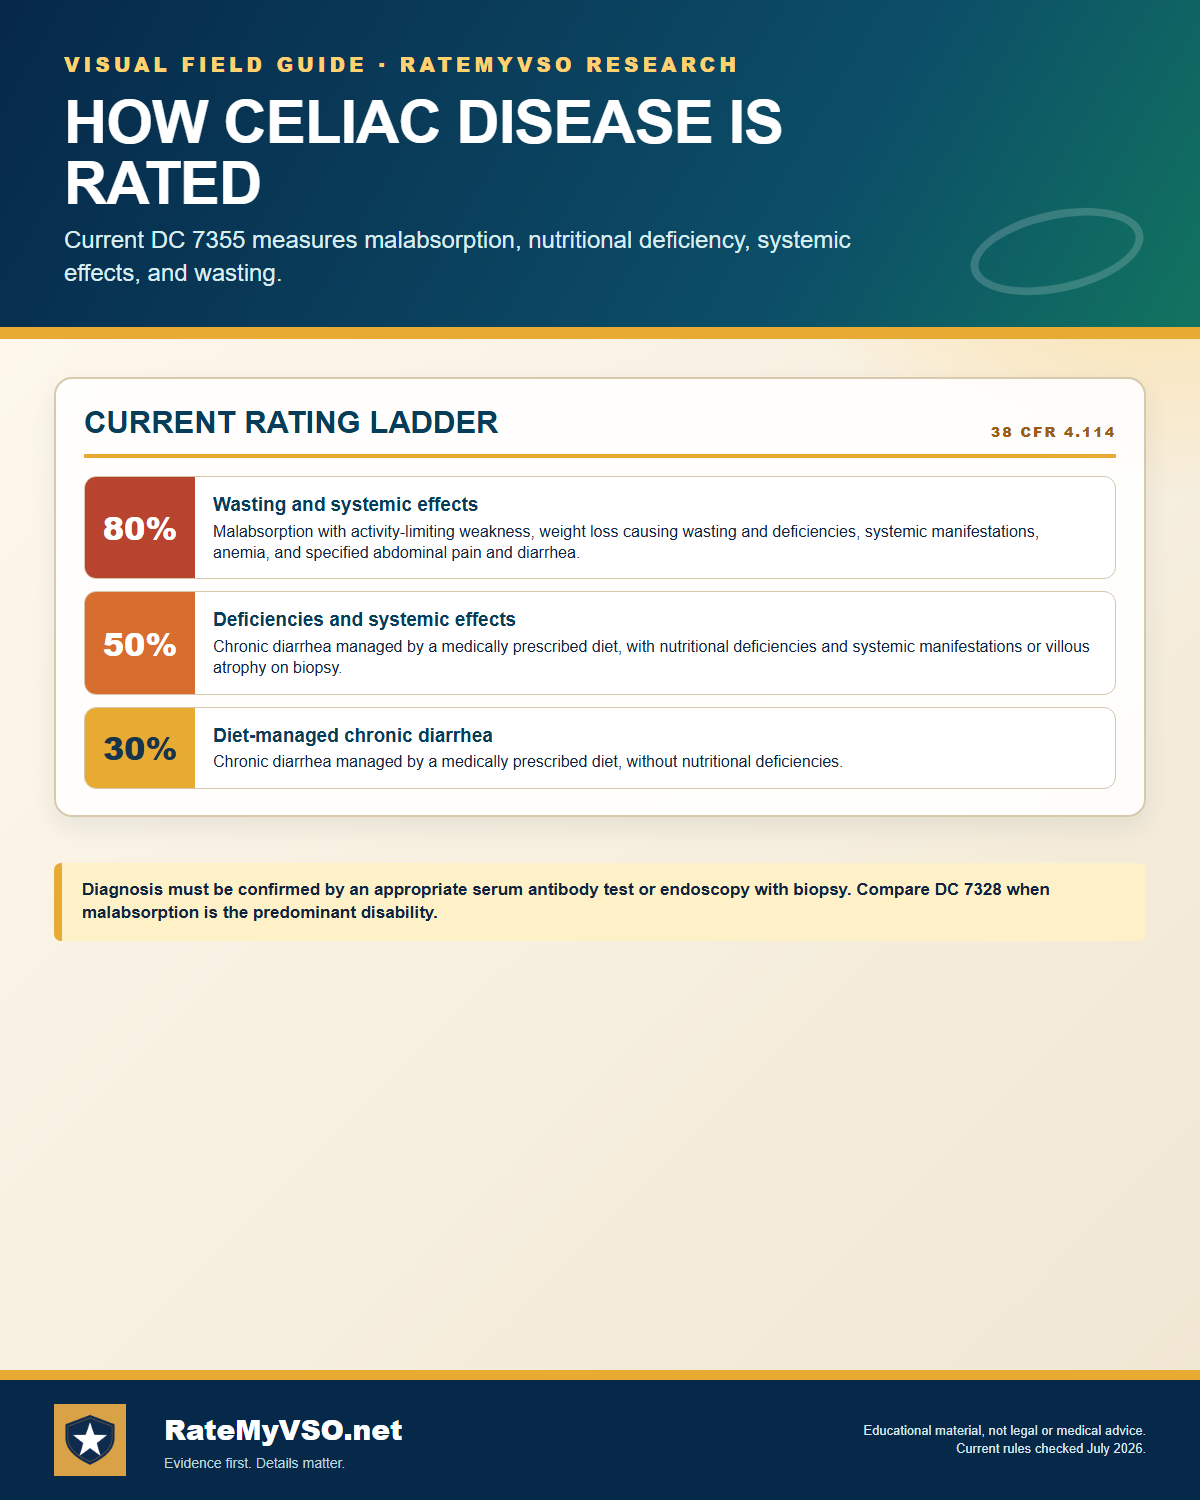
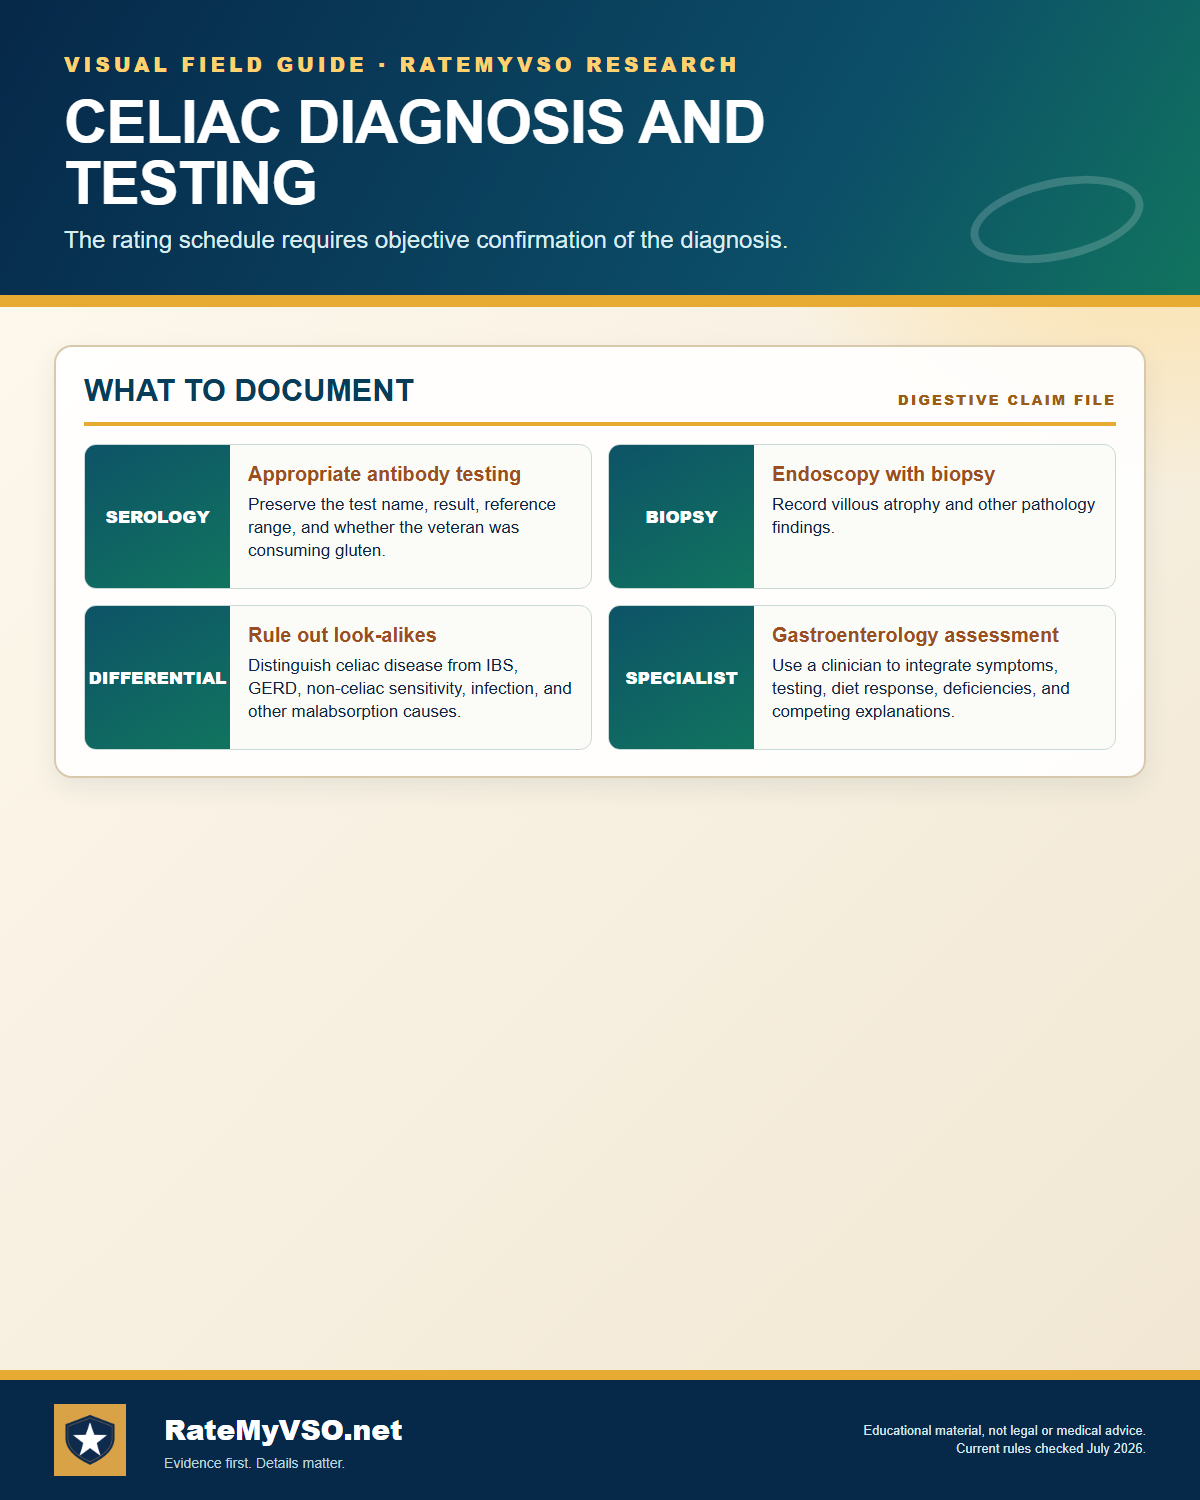
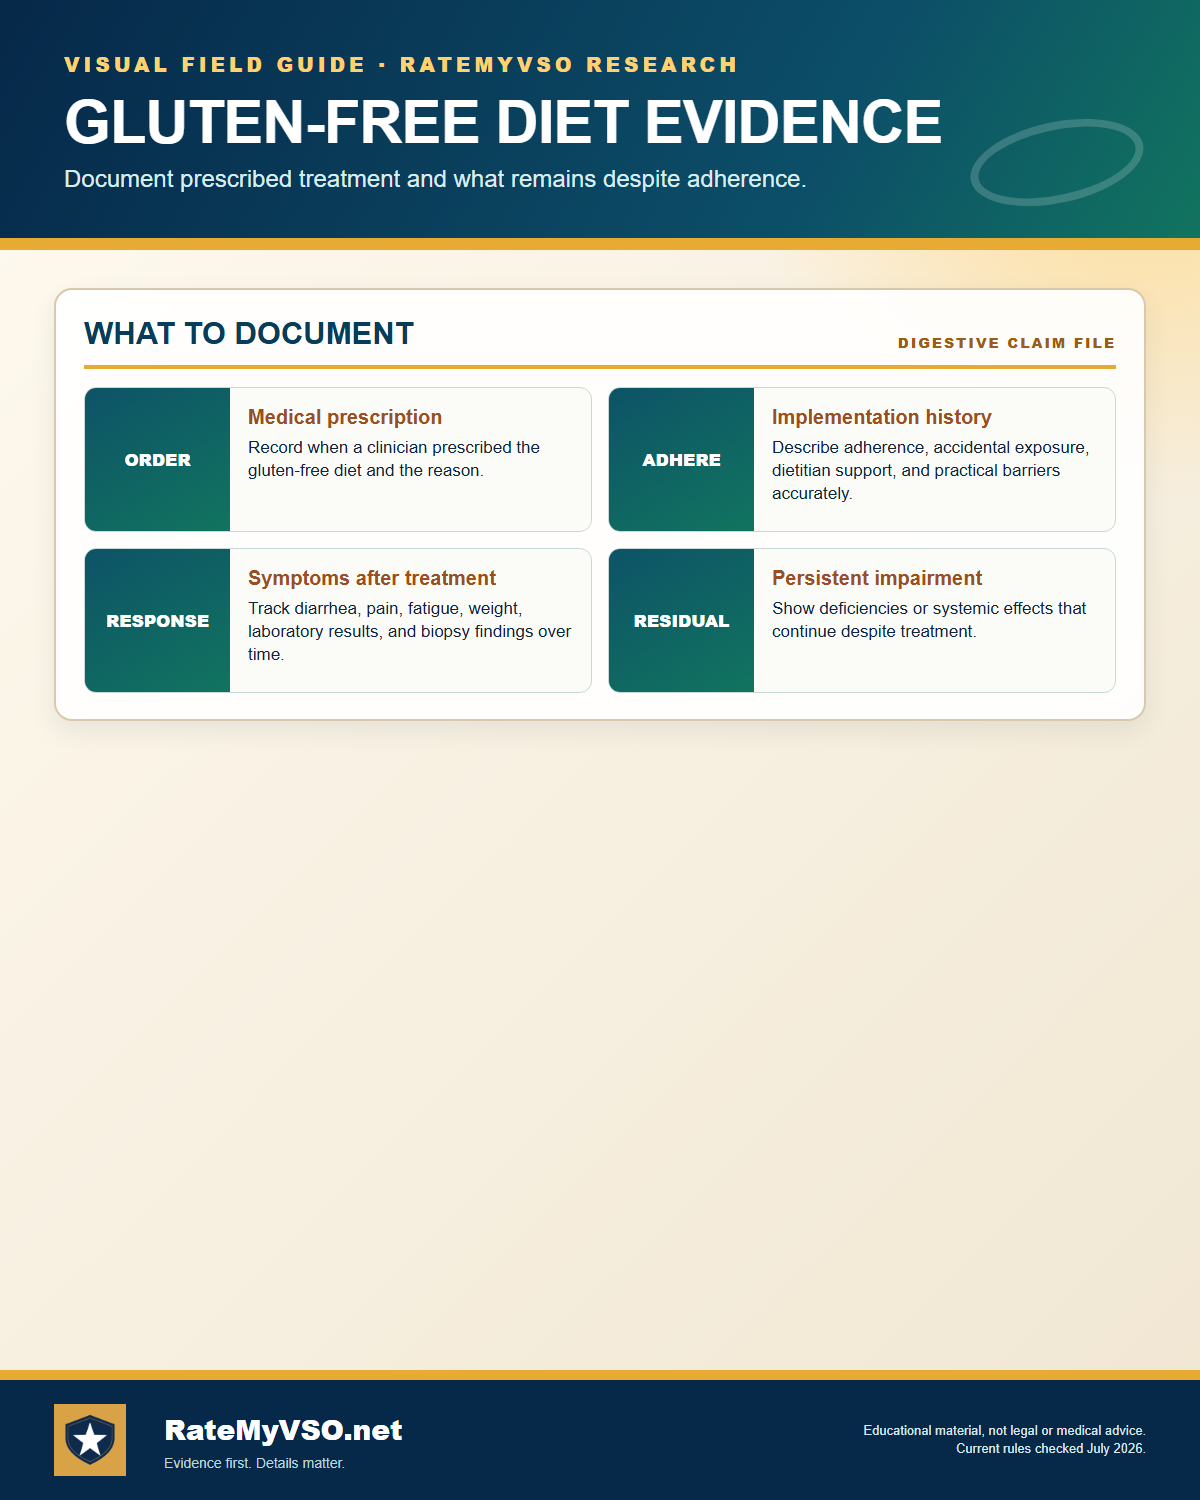
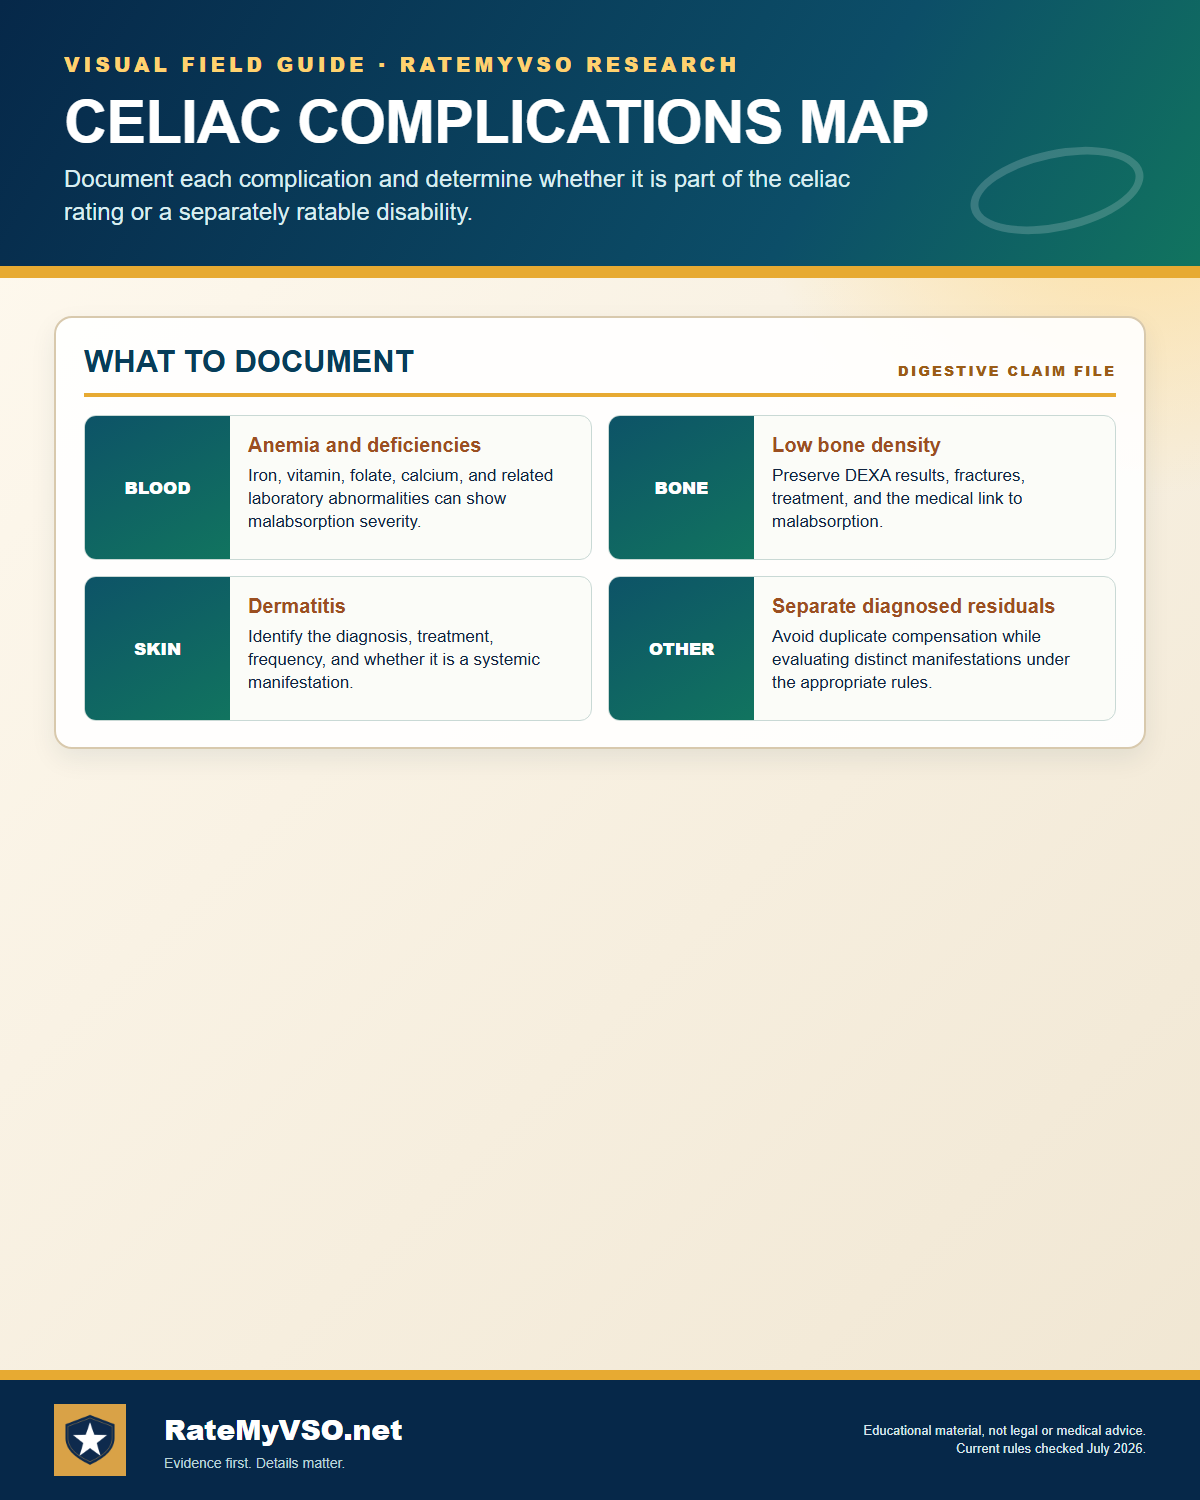
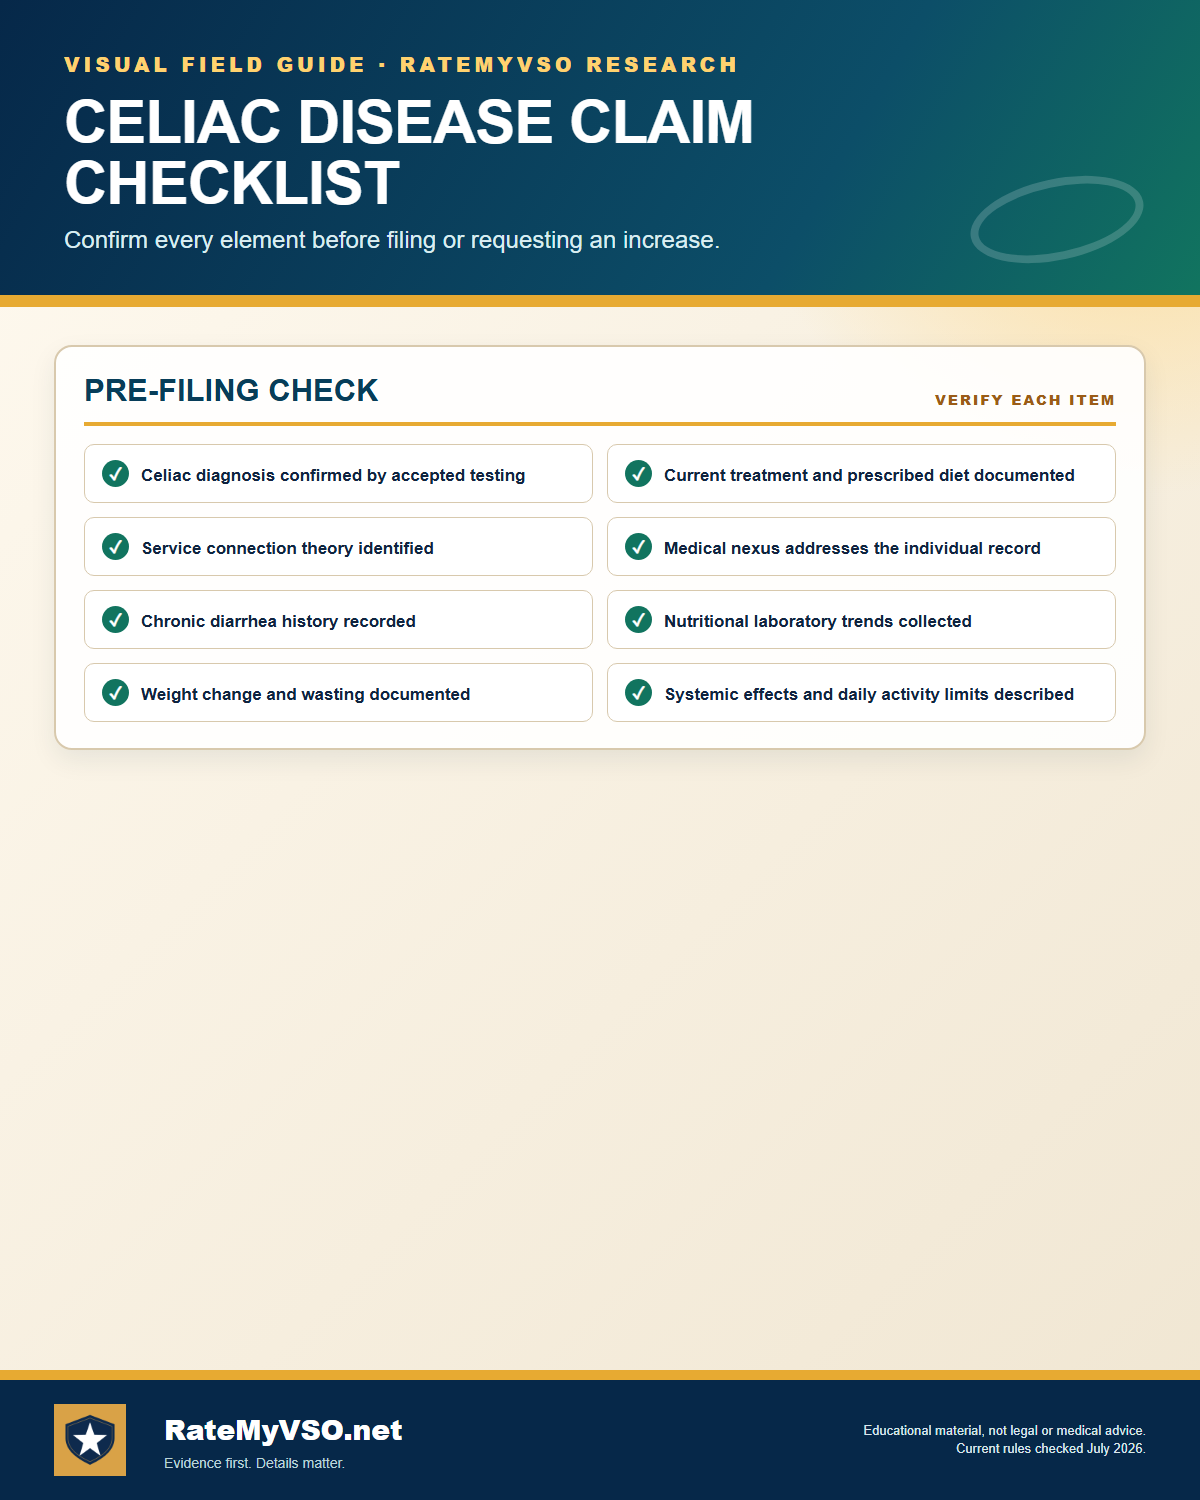
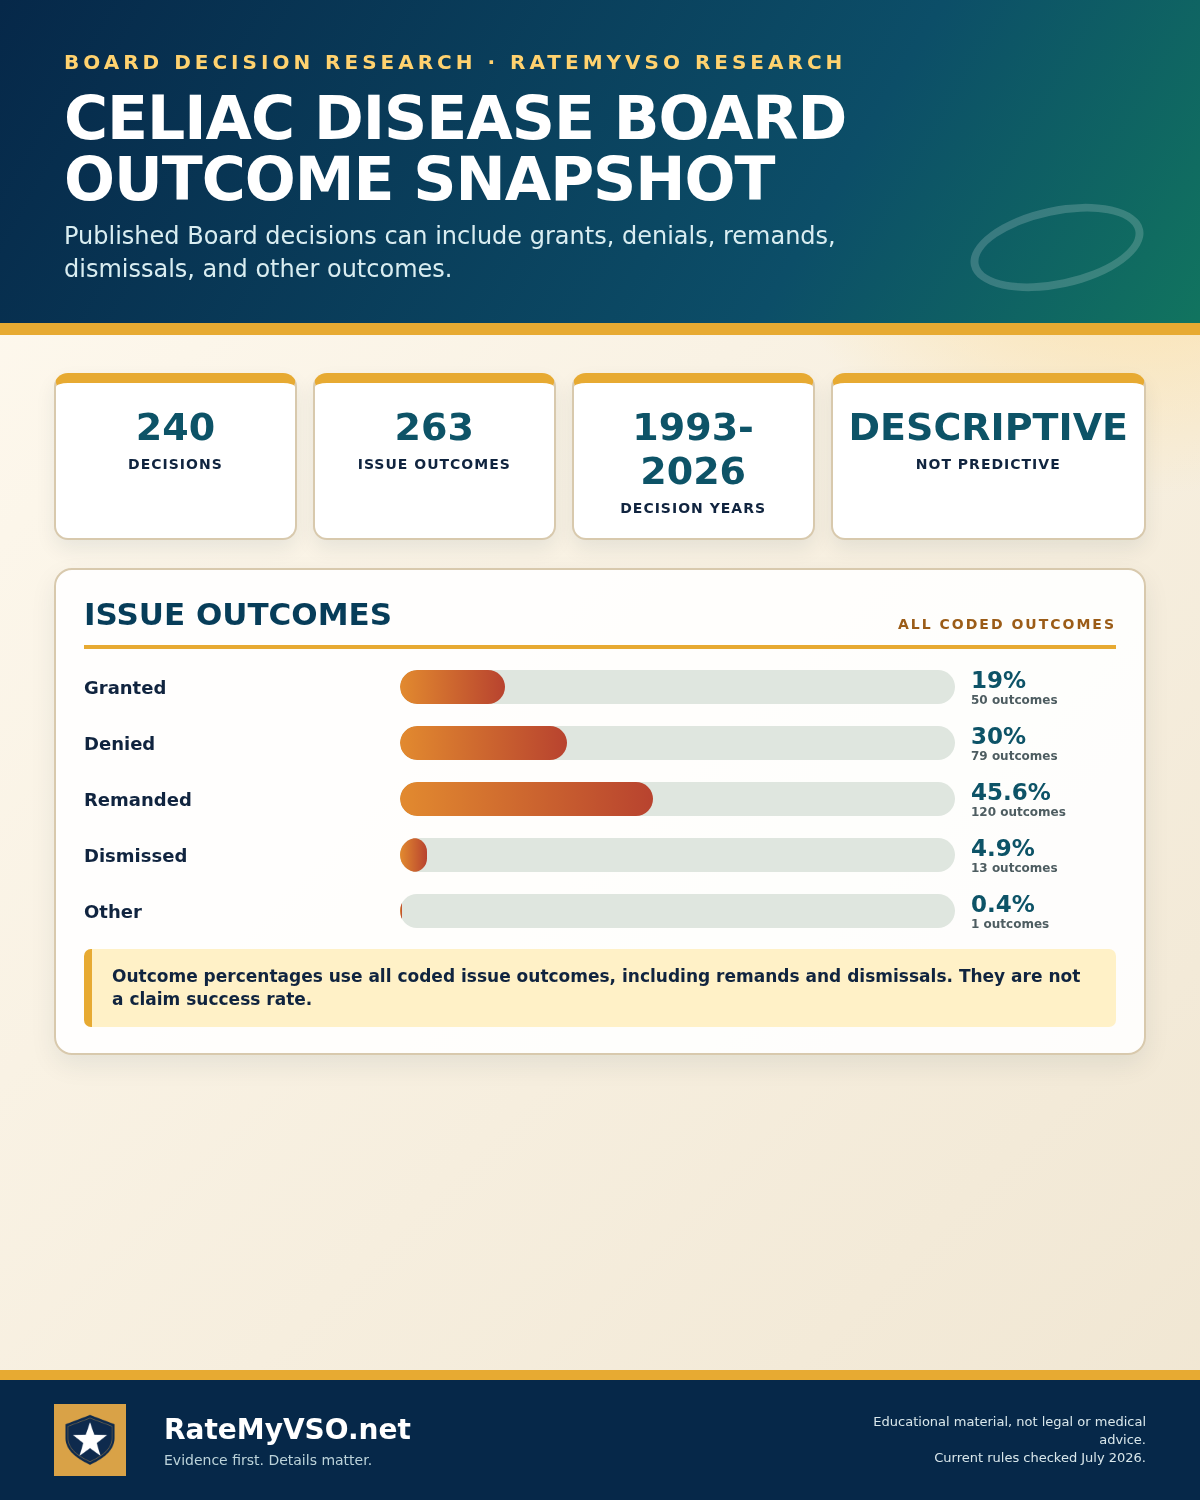
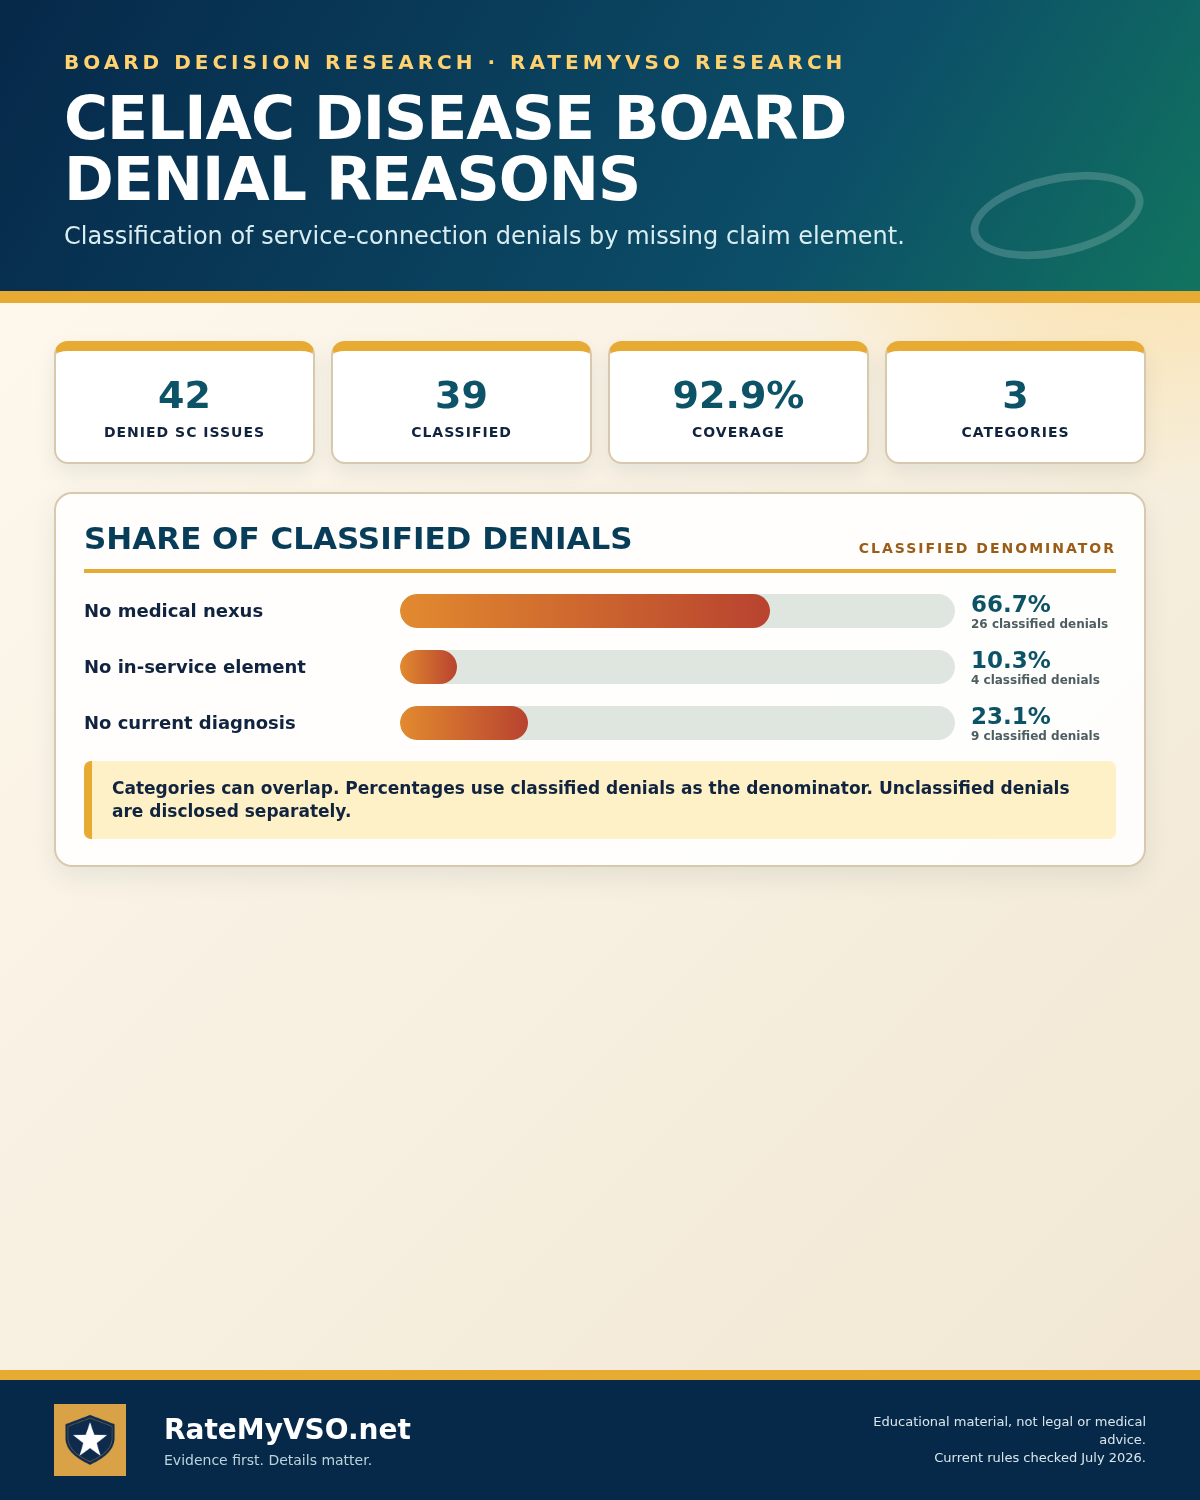
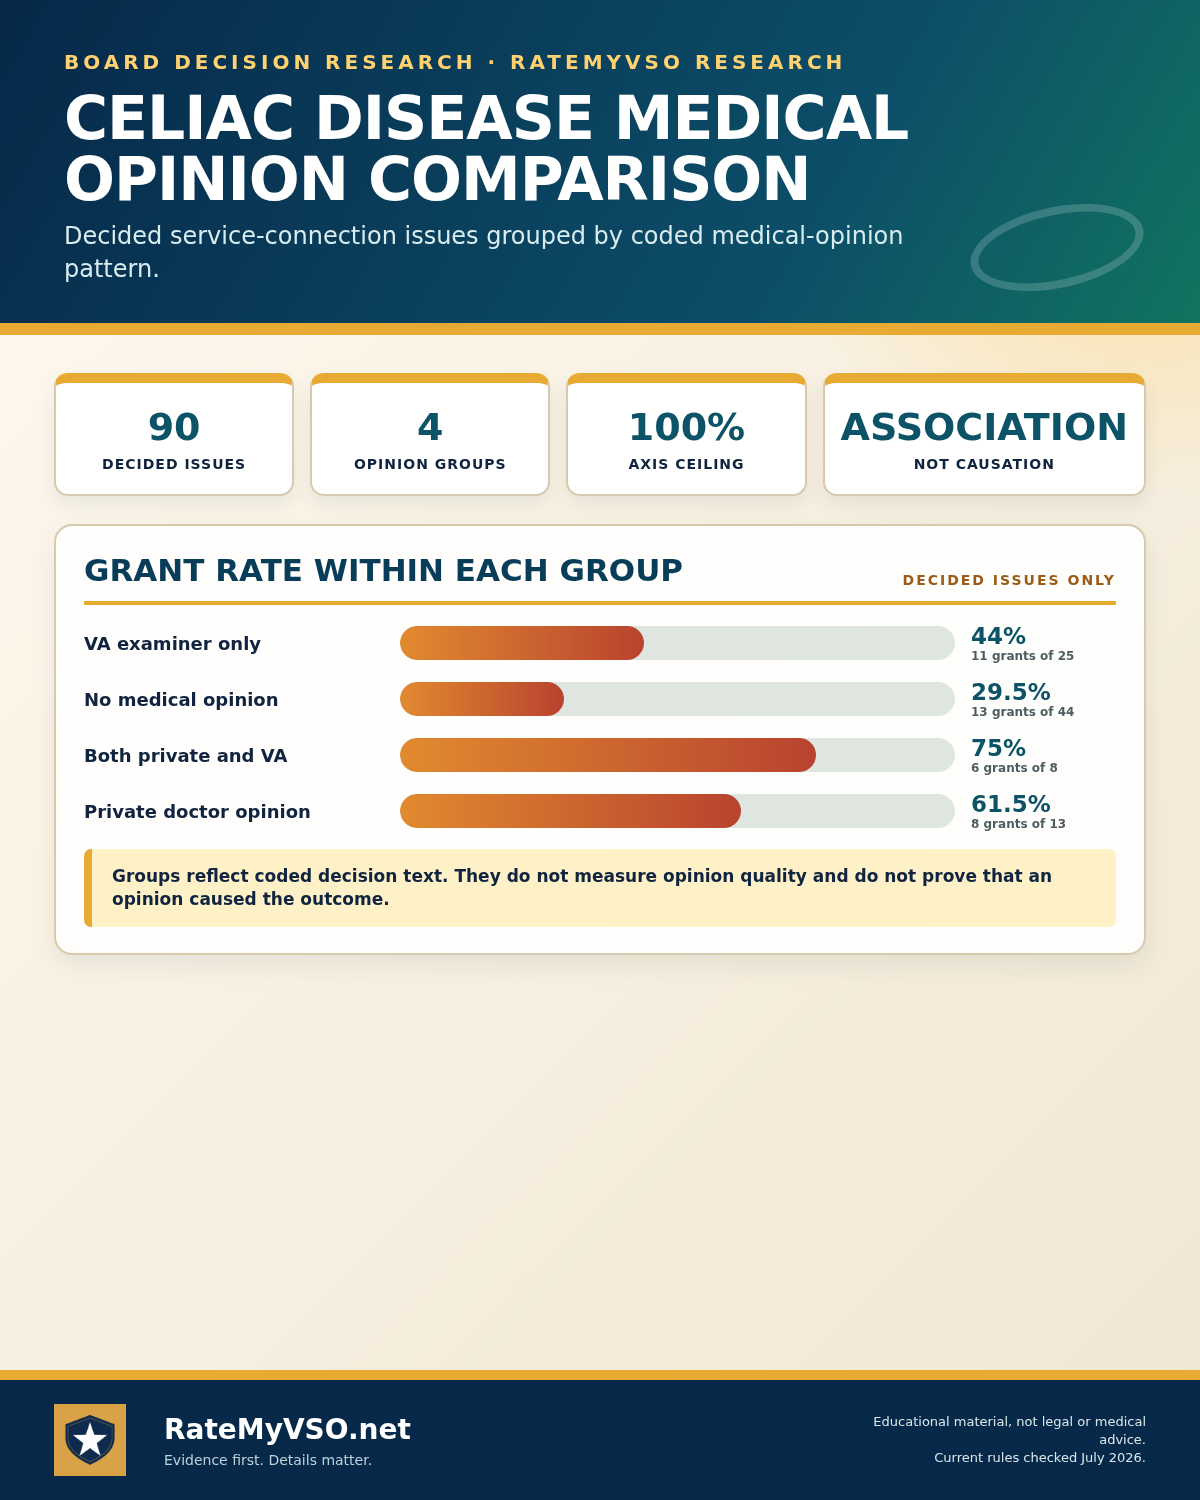
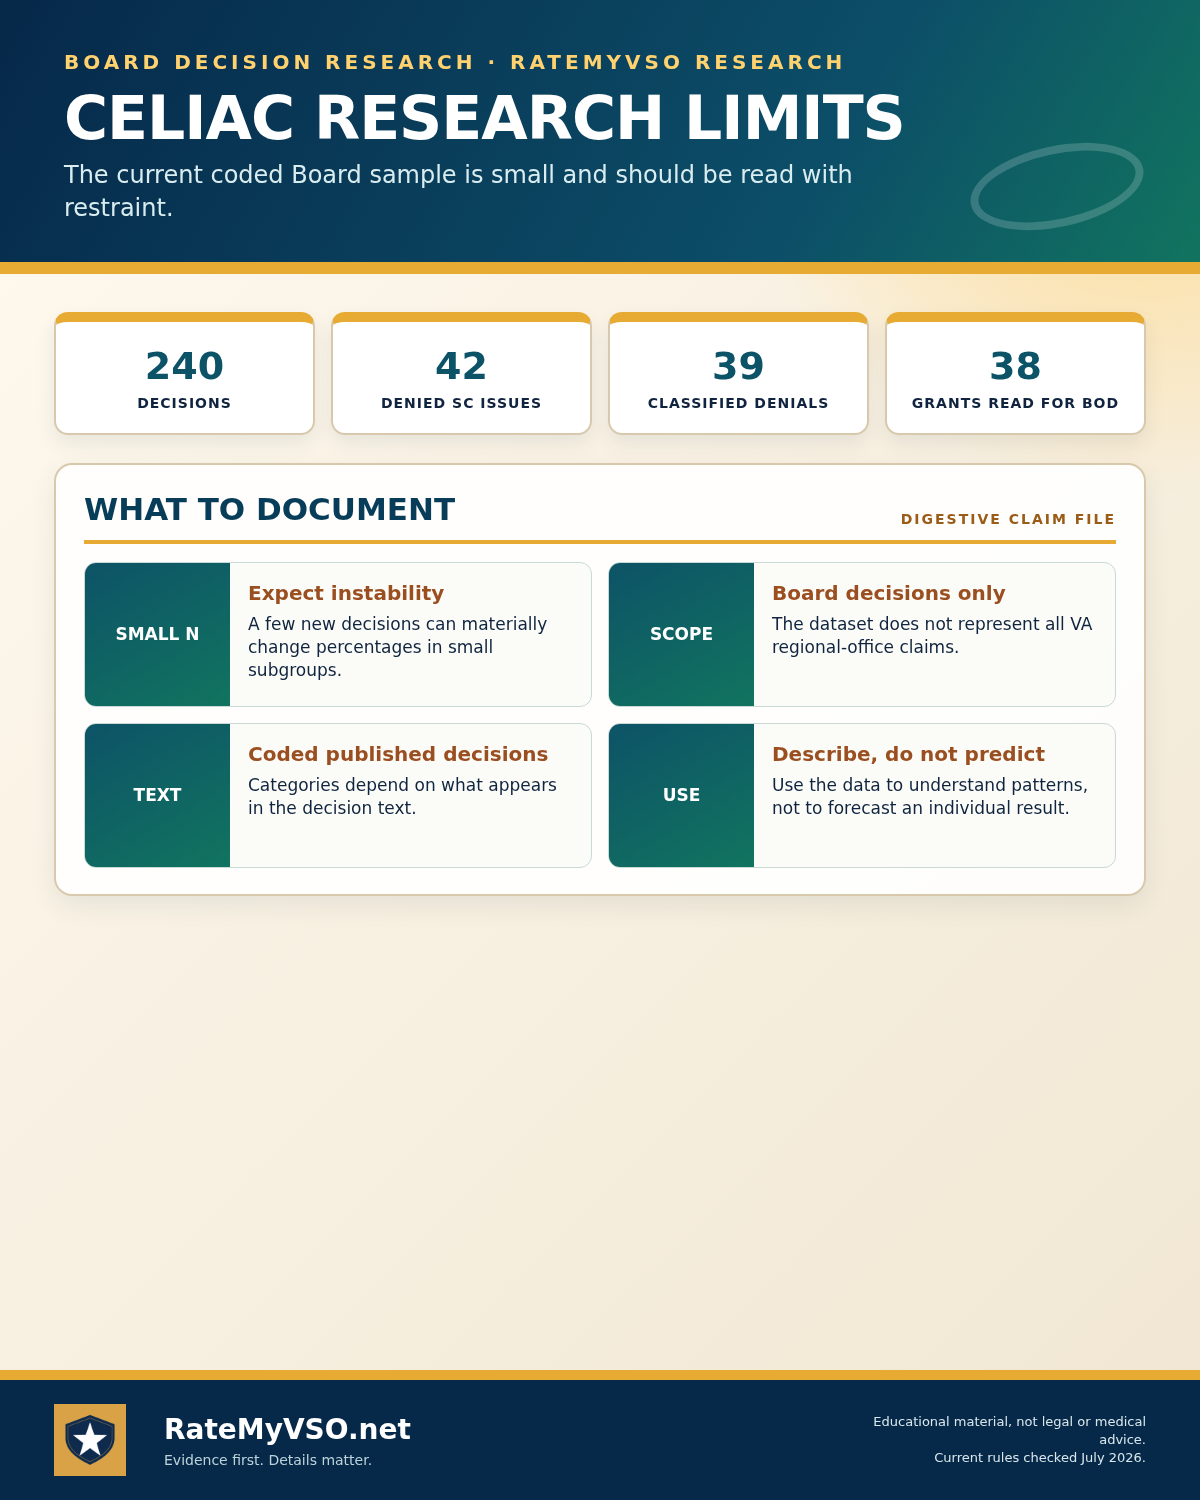
30 printable one-page charts across two digestive conditions, covering how VA GERD and celiac disease claims work: the current Diagnostic Code 7206 ladder that took effect May 19, 2024 and replaced the old analogous hiatal-hernia framework, what documented stricture and dysphagia actually have to show, the direct, secondary, aggravation and medication pathways to service connection, the Diagnostic Code 7355 celiac malabsorption levels and why a medically prescribed gluten-free diet is written into the criteria rather than counted against you, the nutritional laboratory and biopsy evidence that separates one level from the next, what happens at the examination, and research on the outcomes, denial reasons and opinion patterns that appear in published Board decisions.
All 30 visual guides
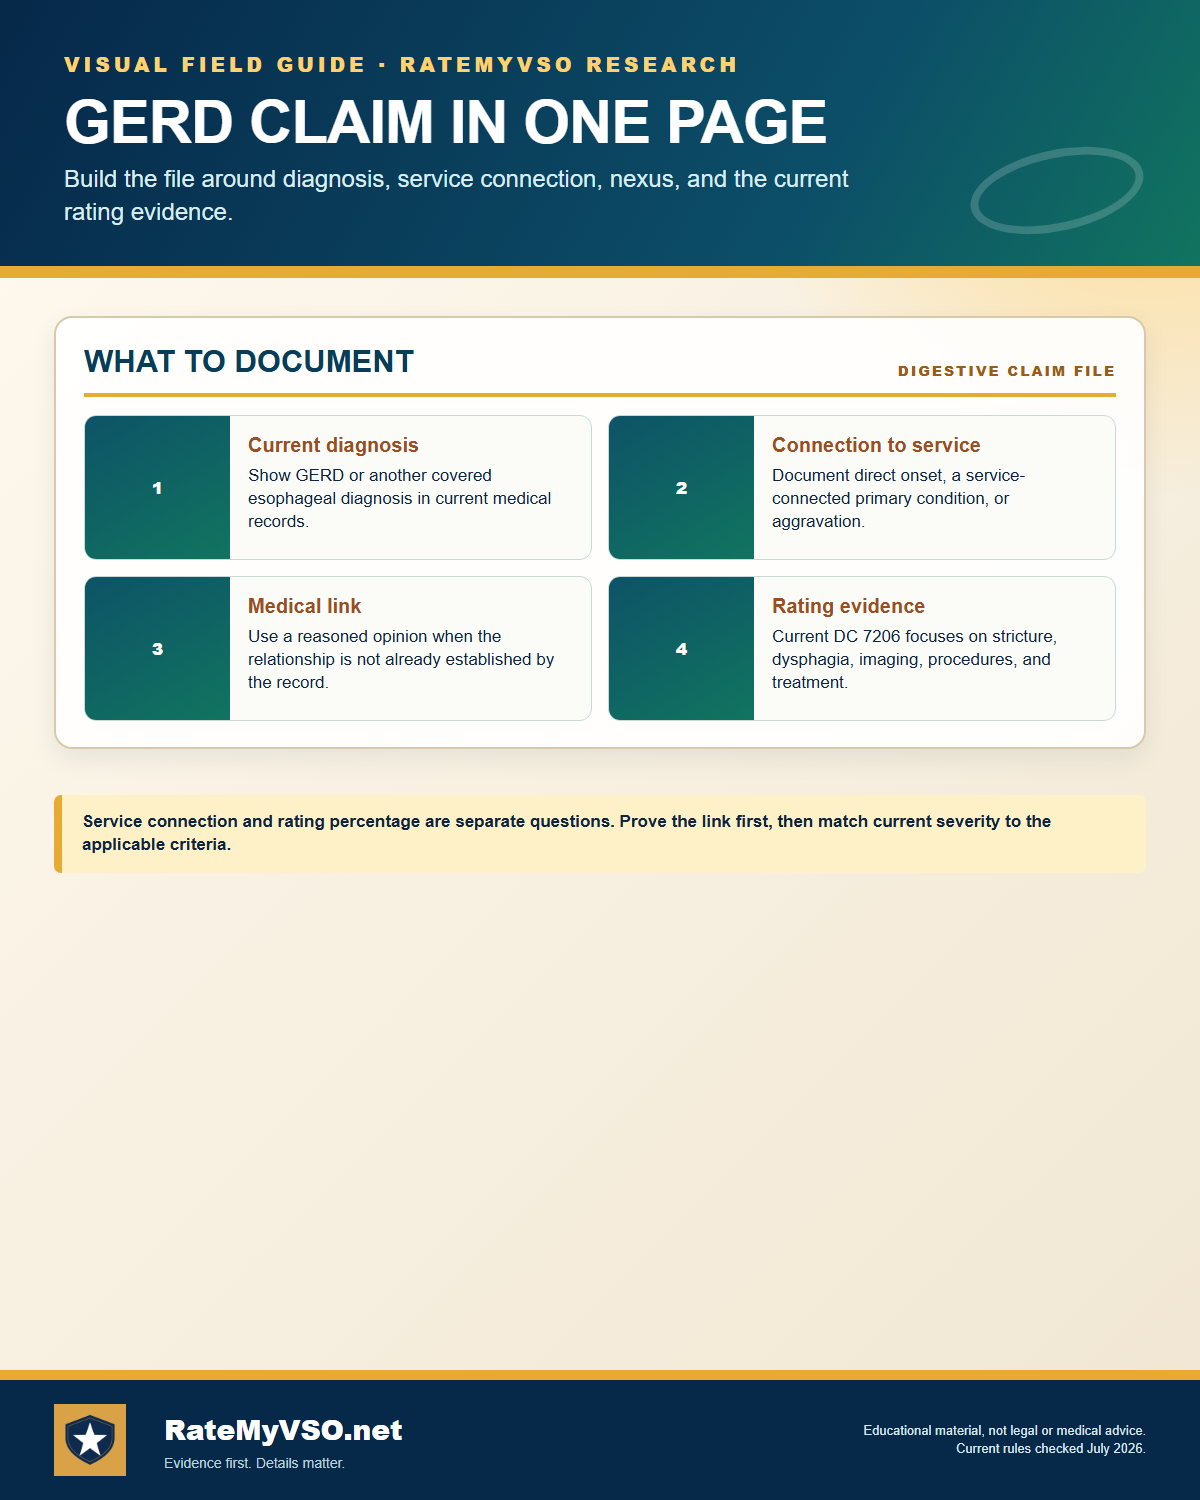
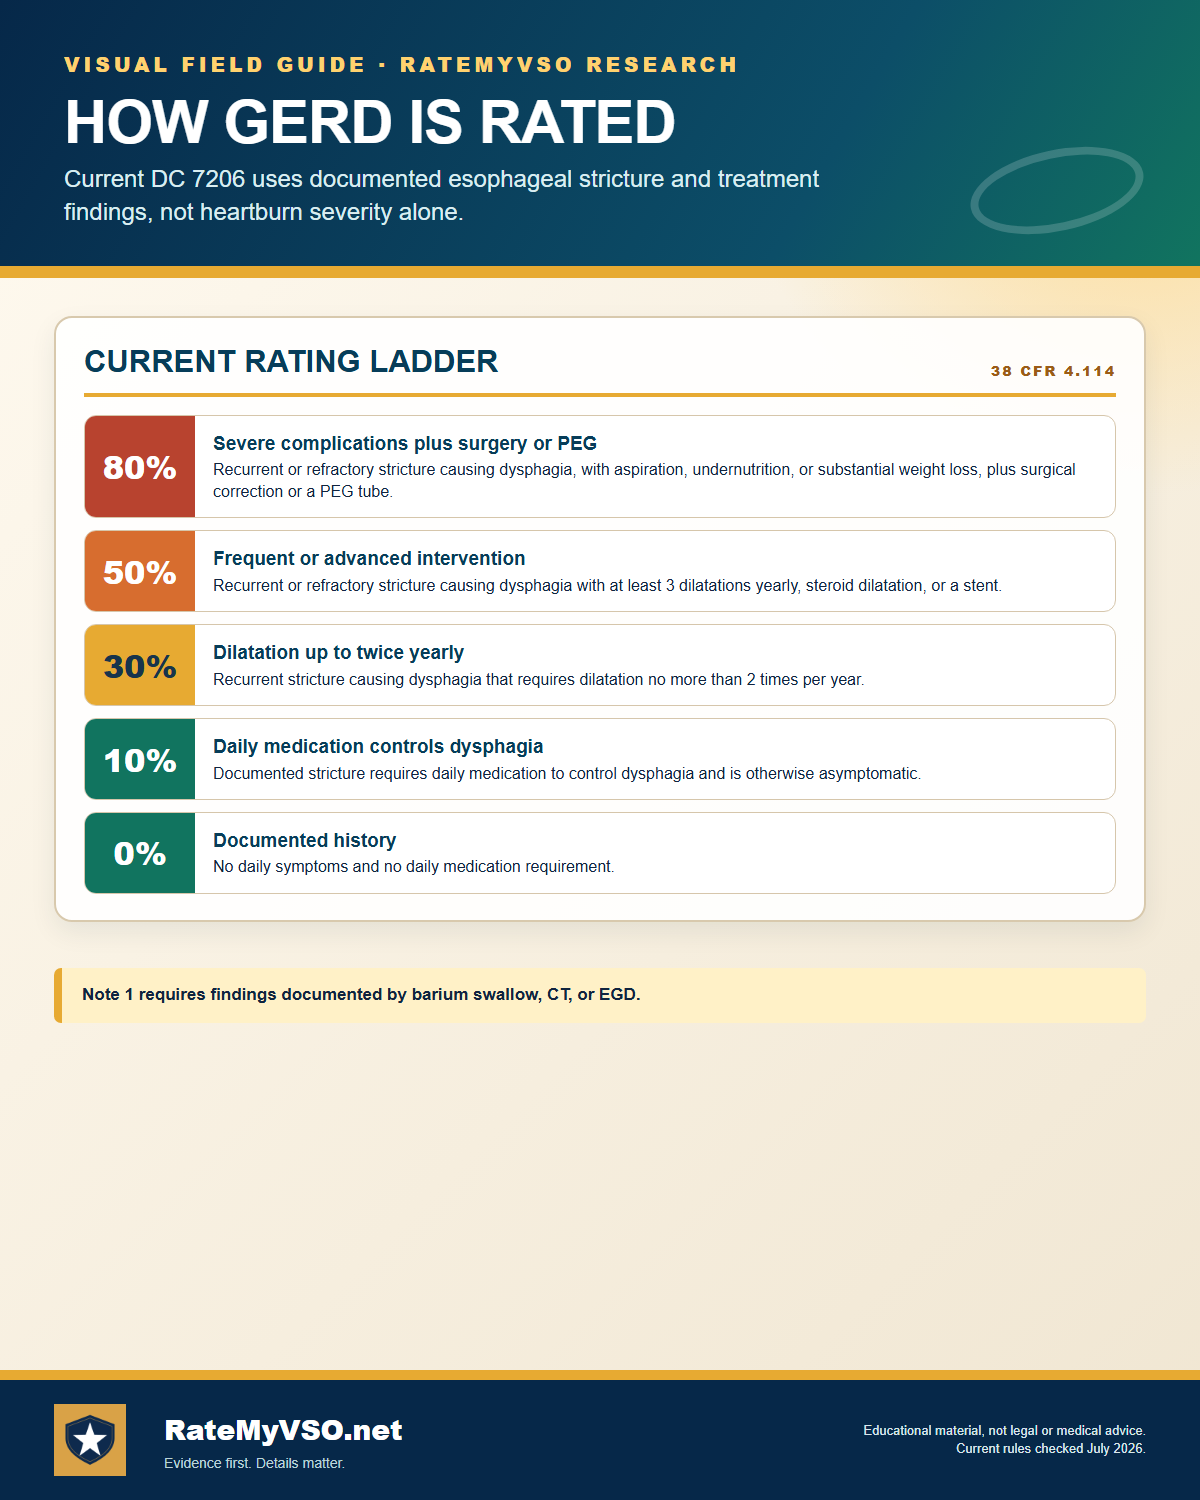
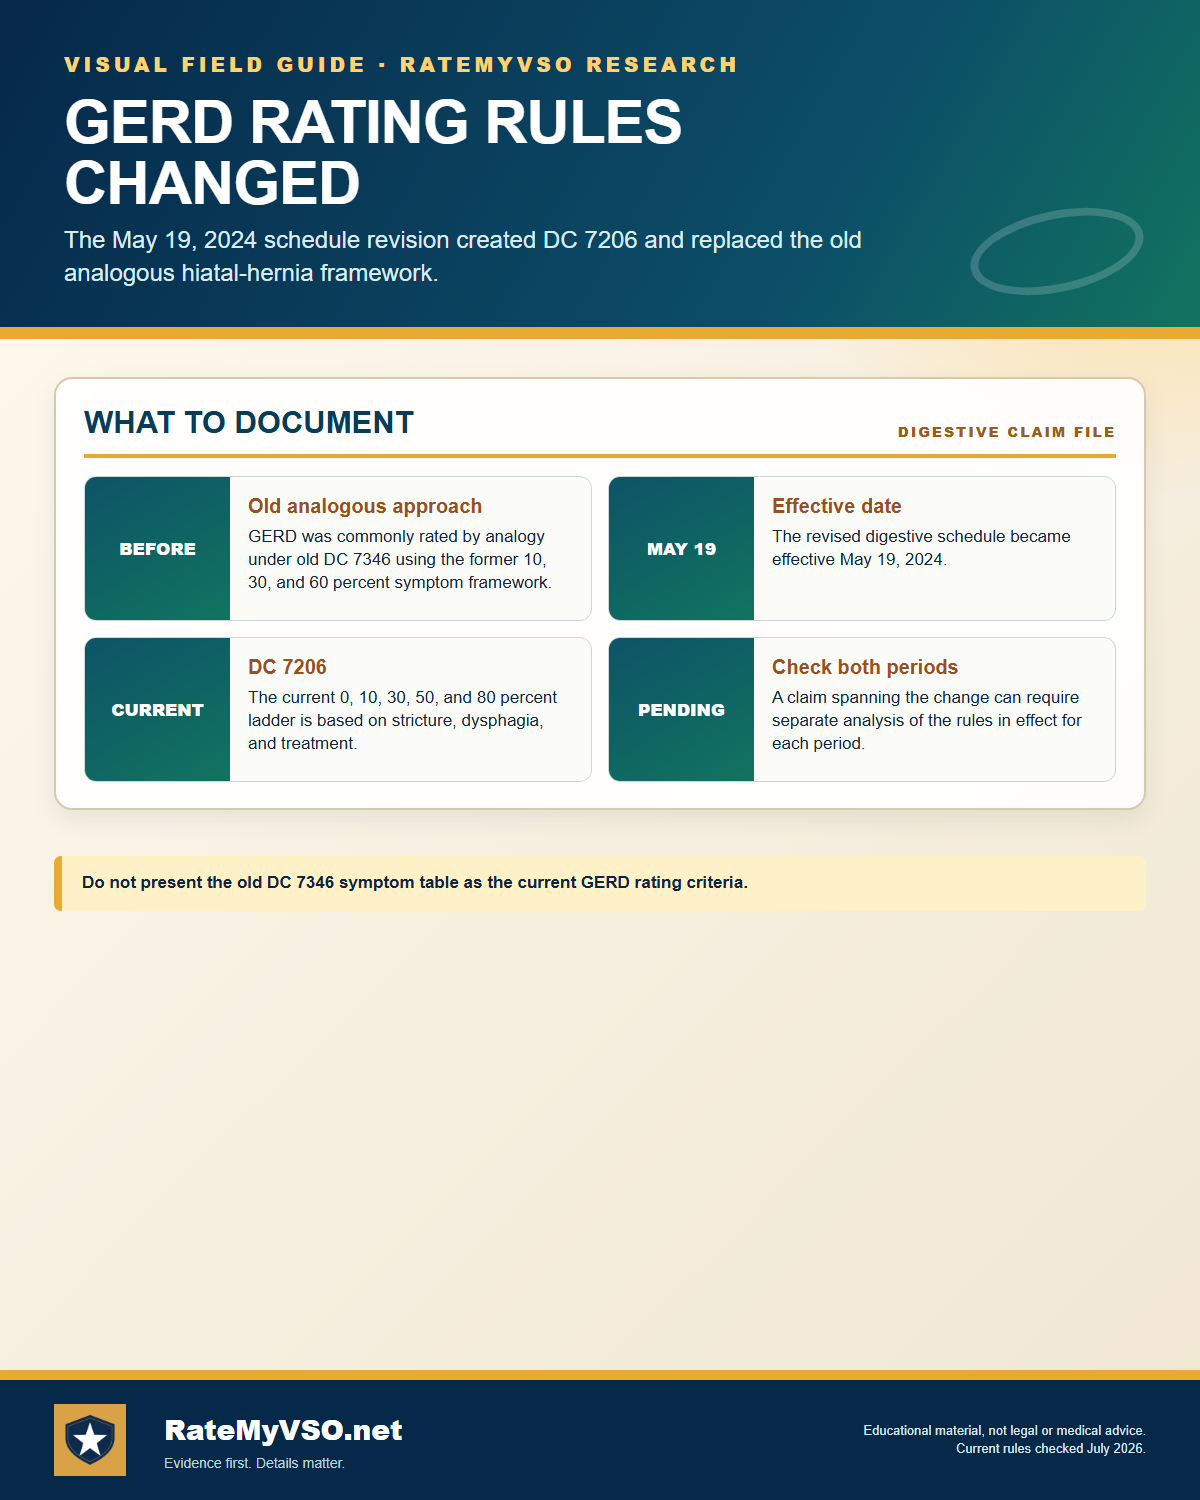
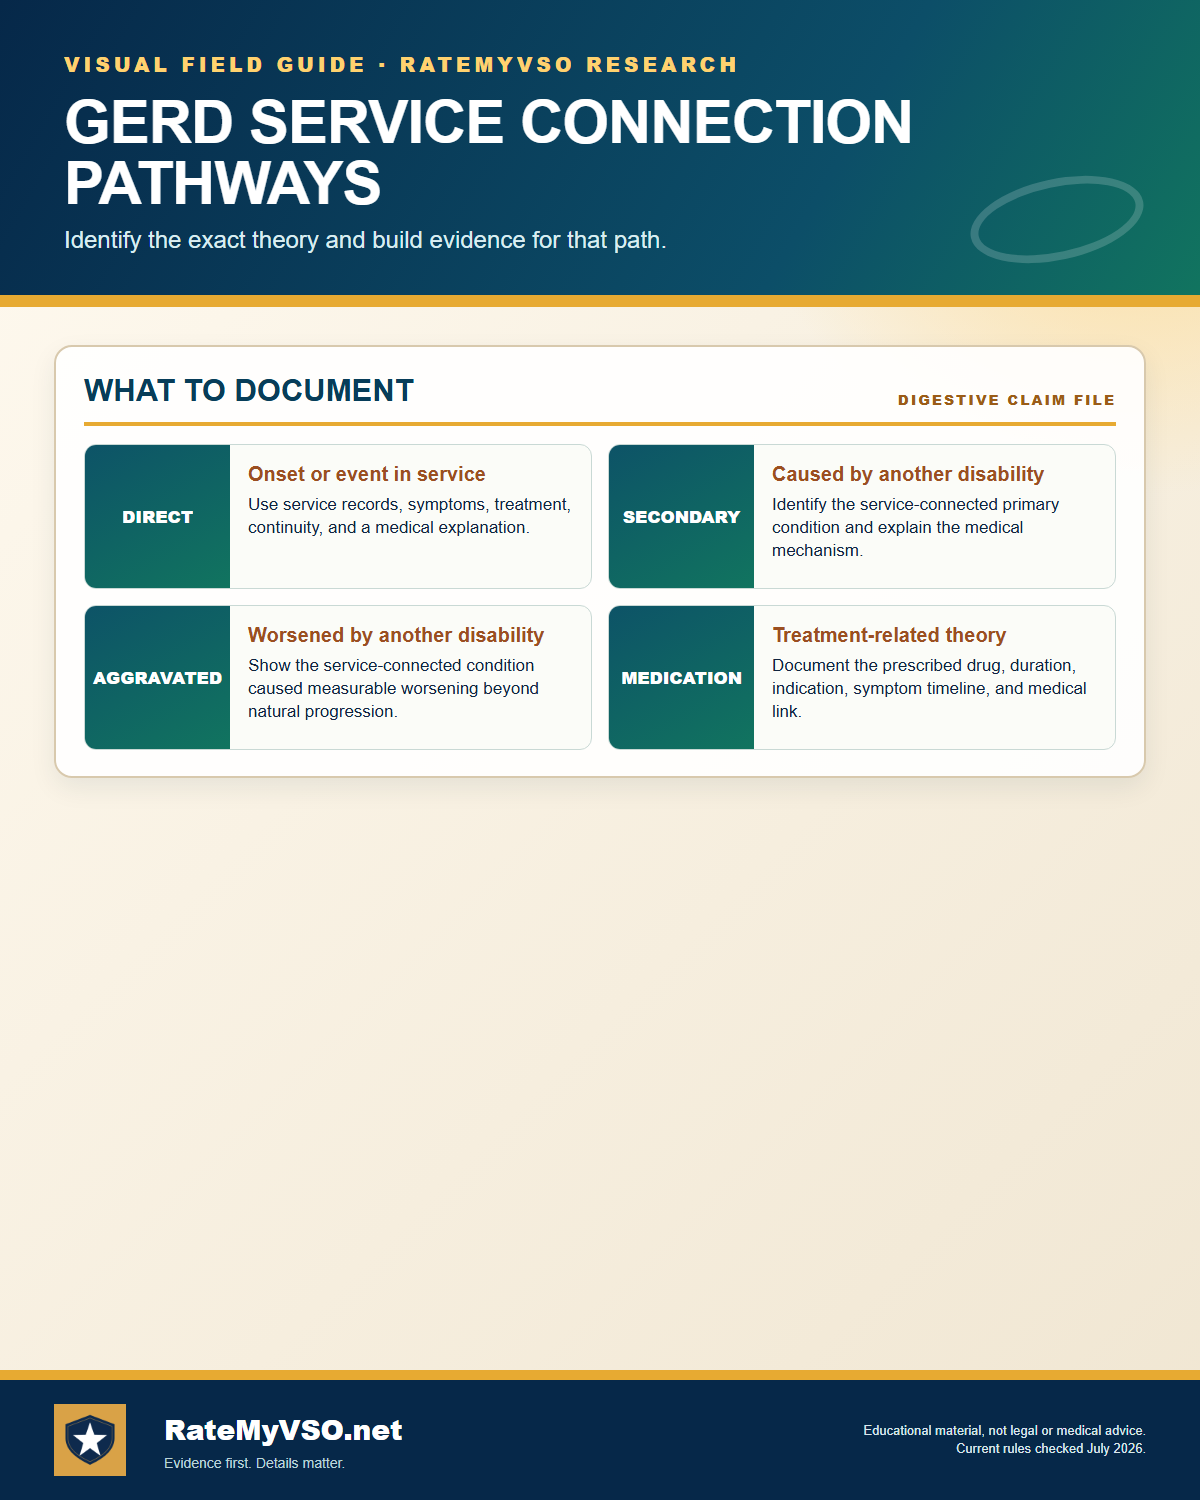
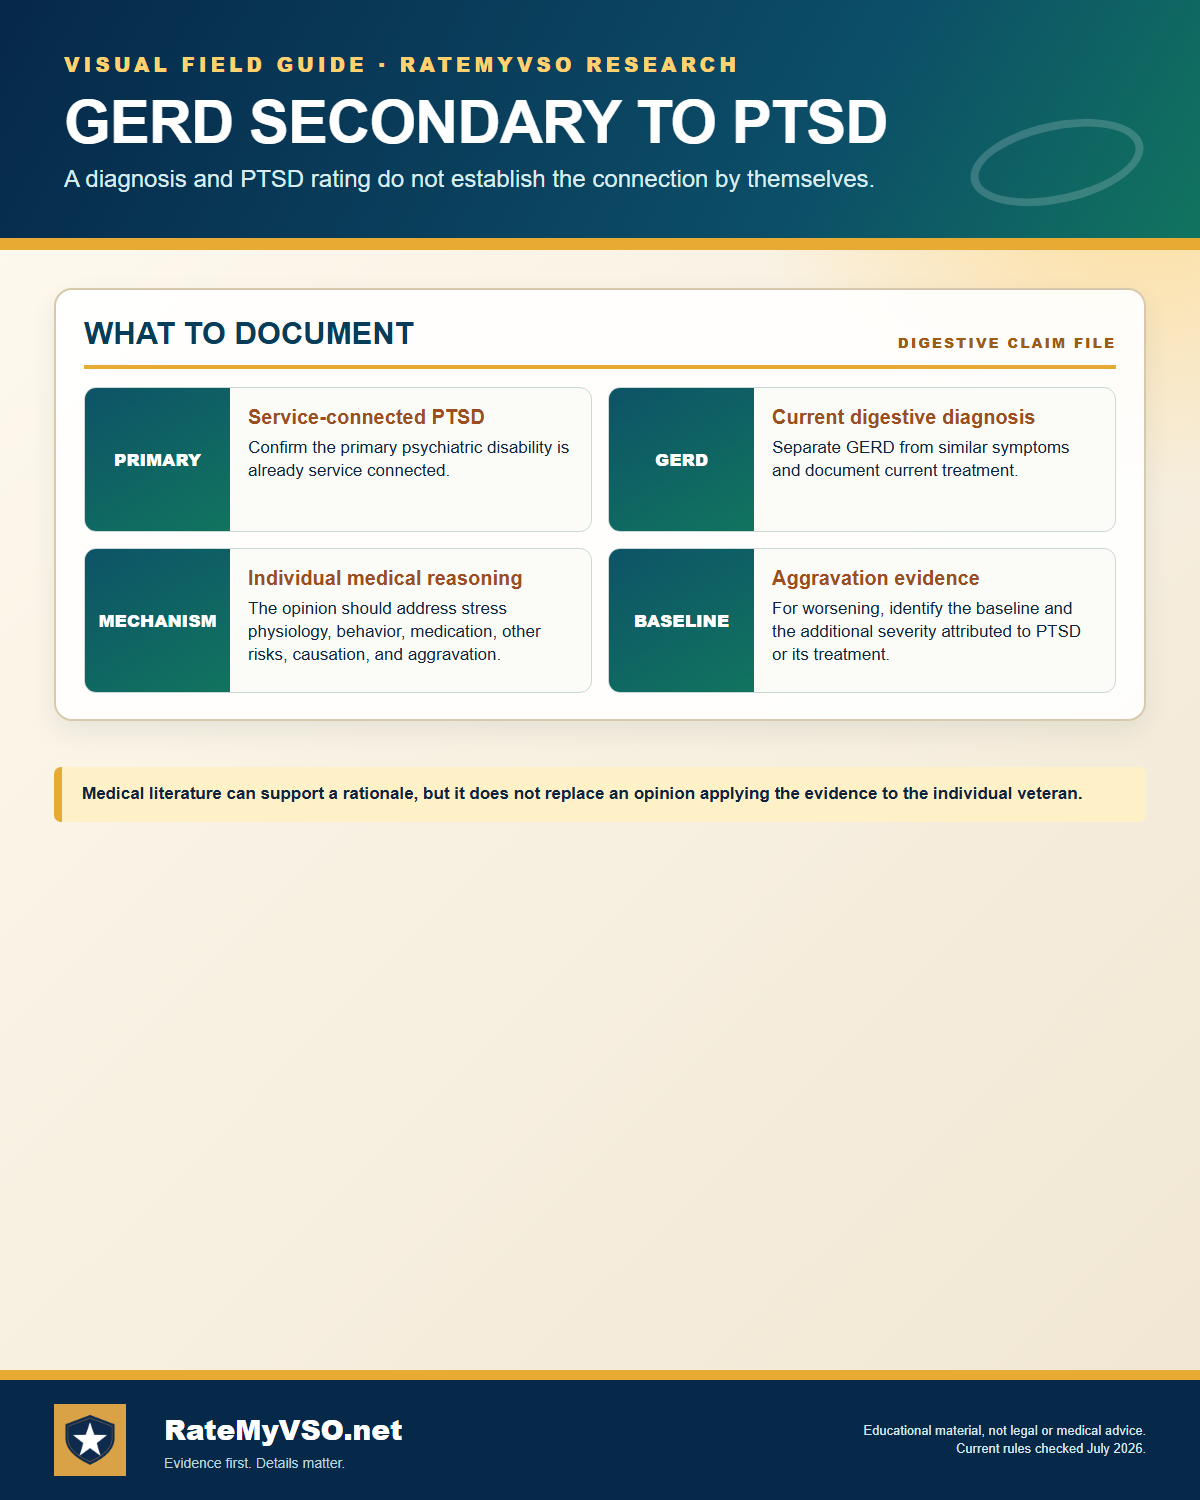
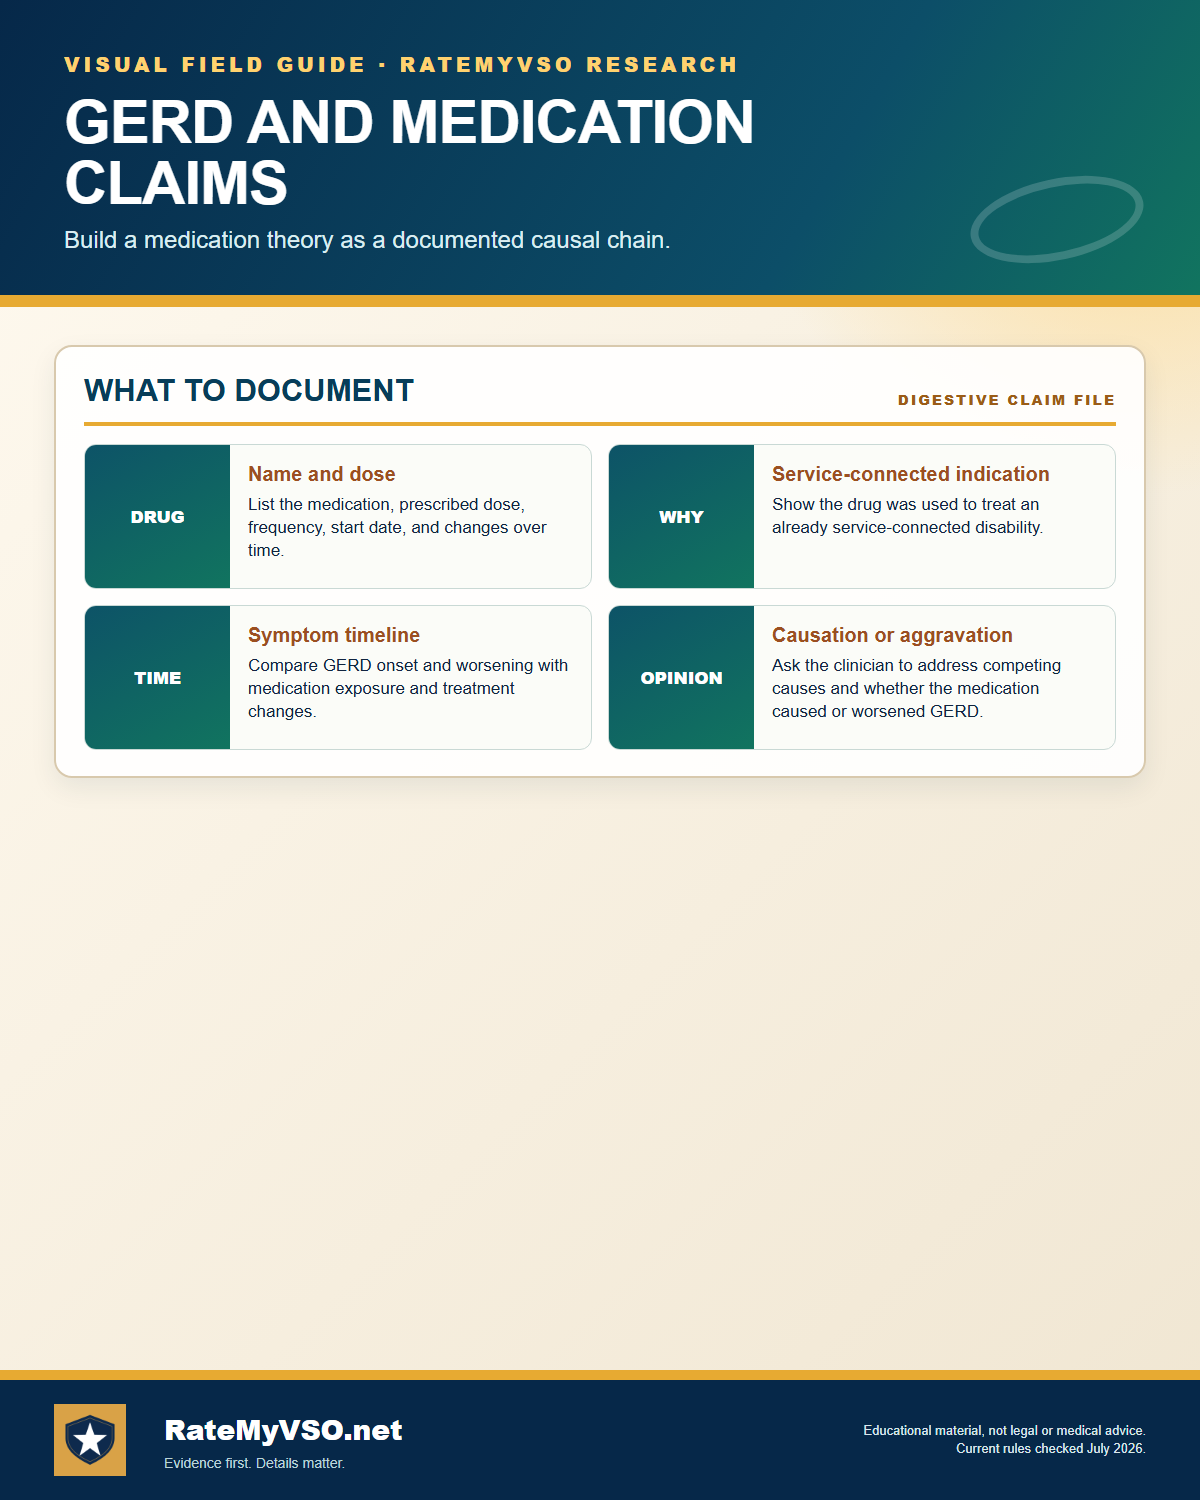
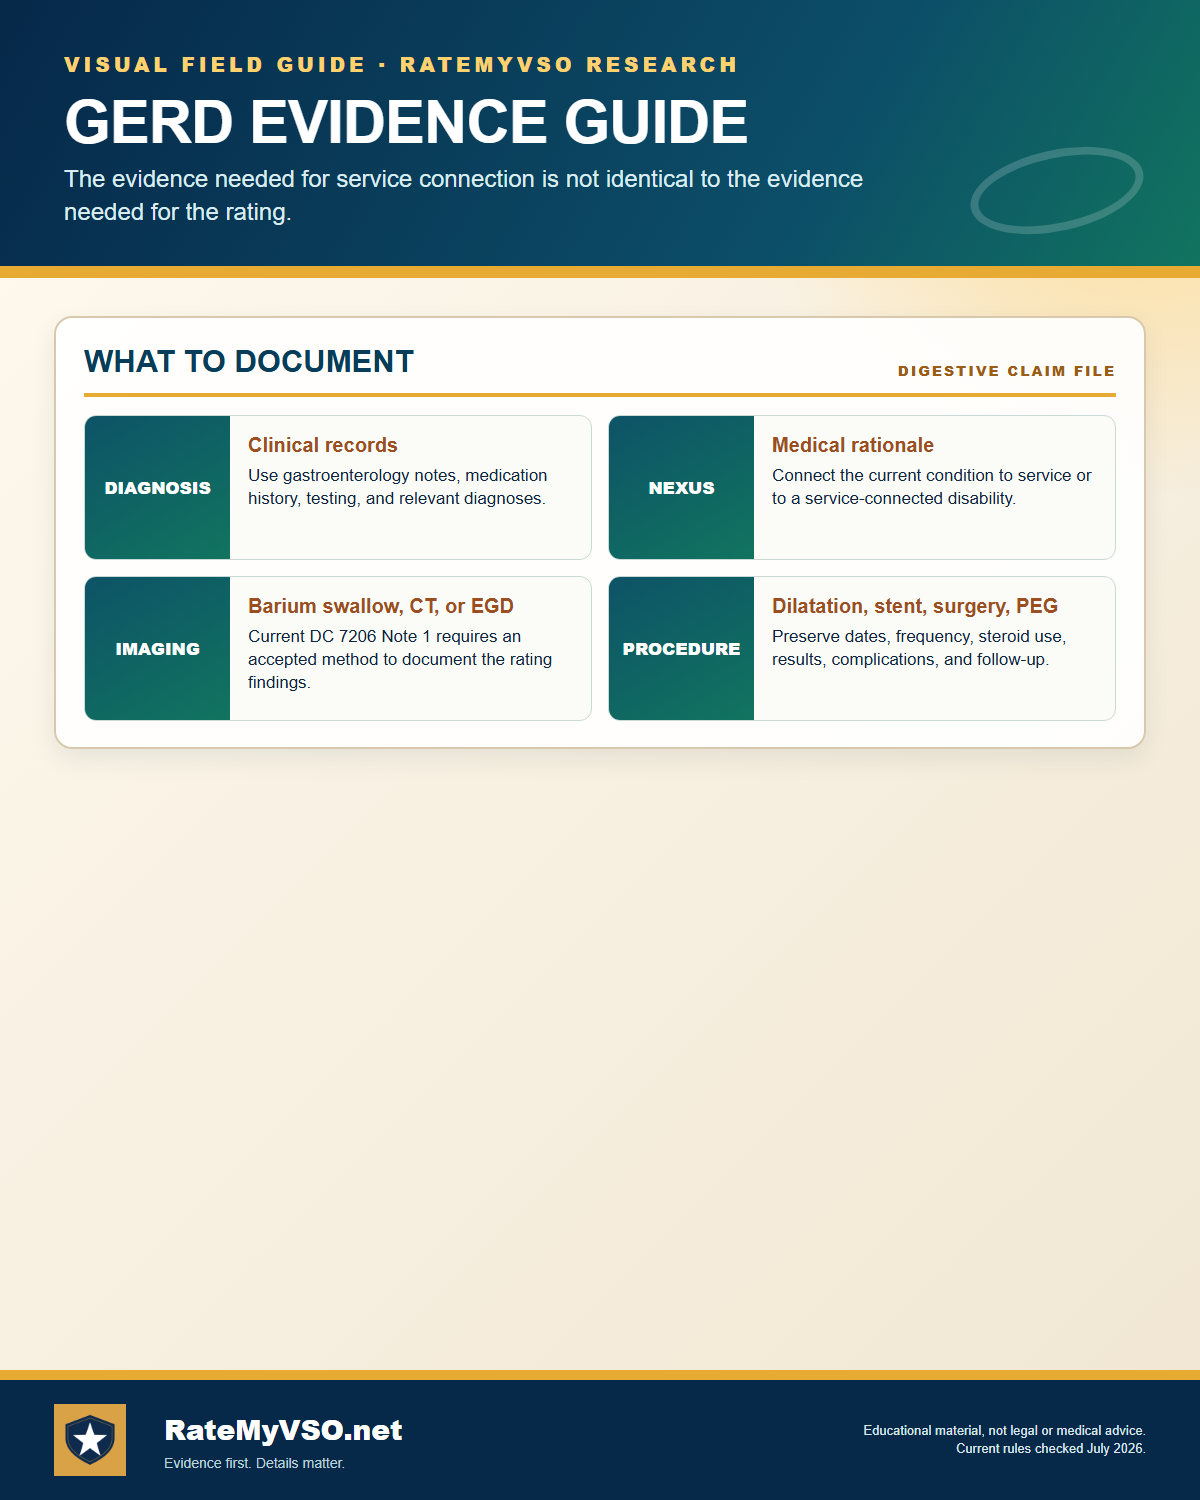
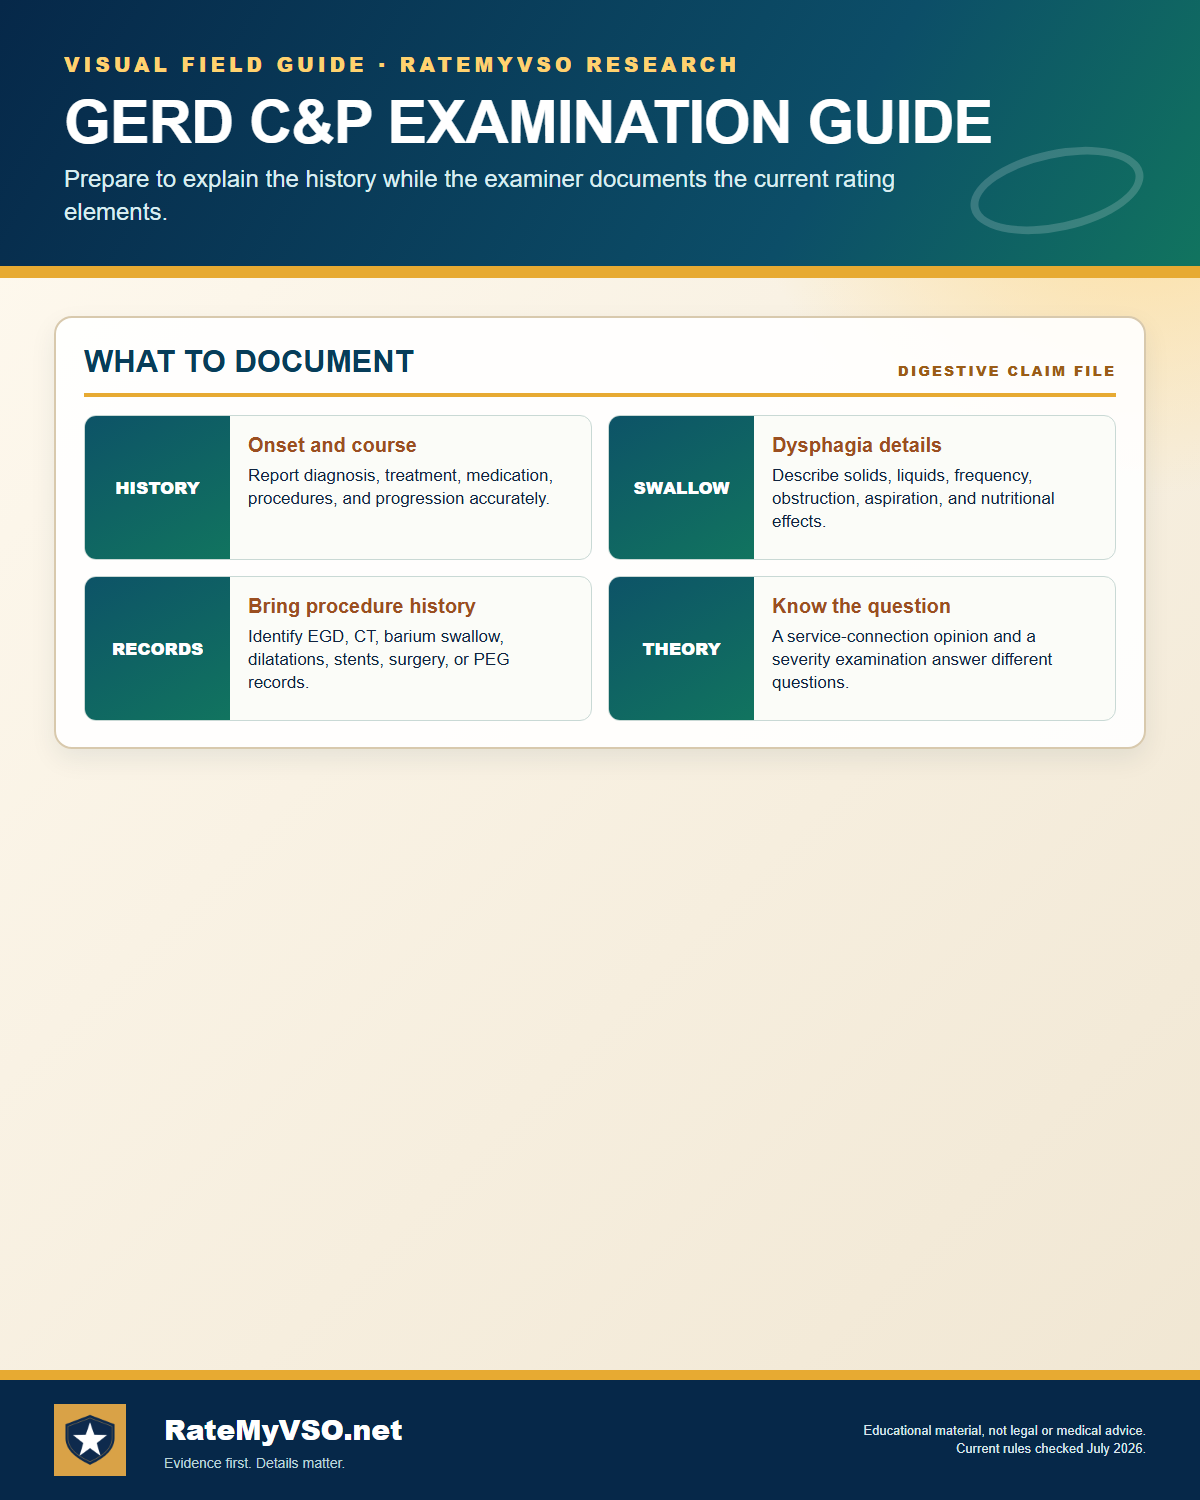
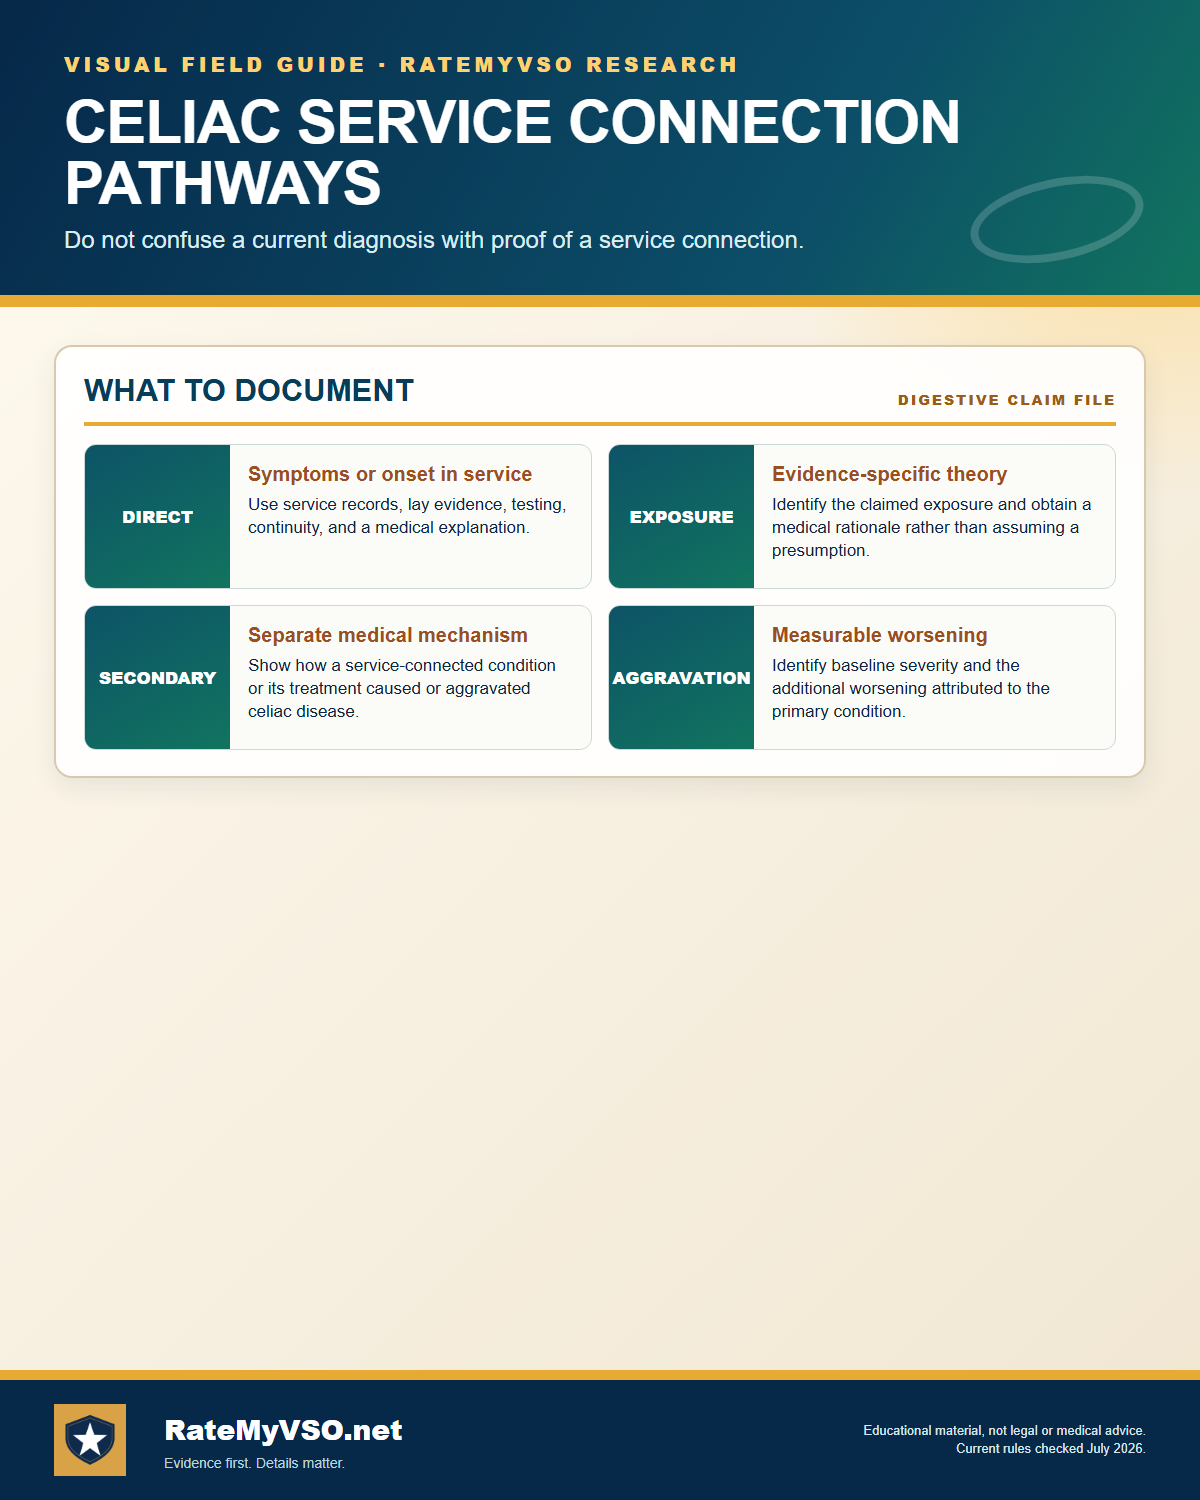
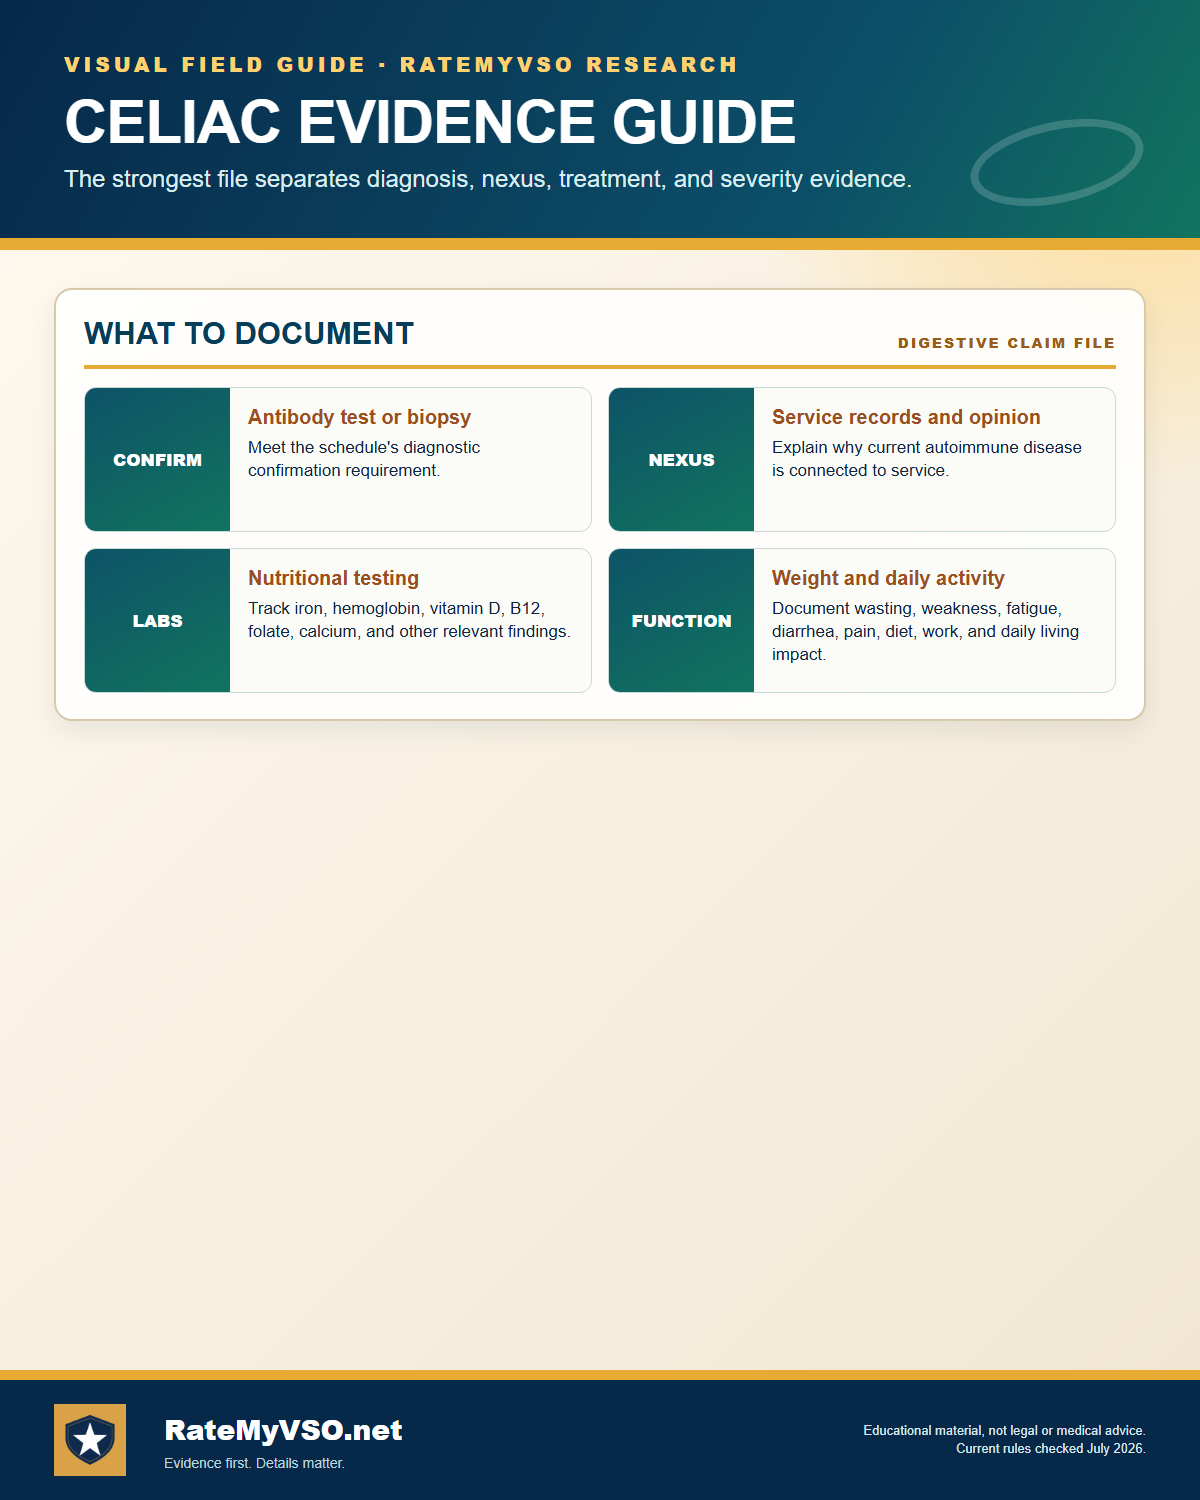
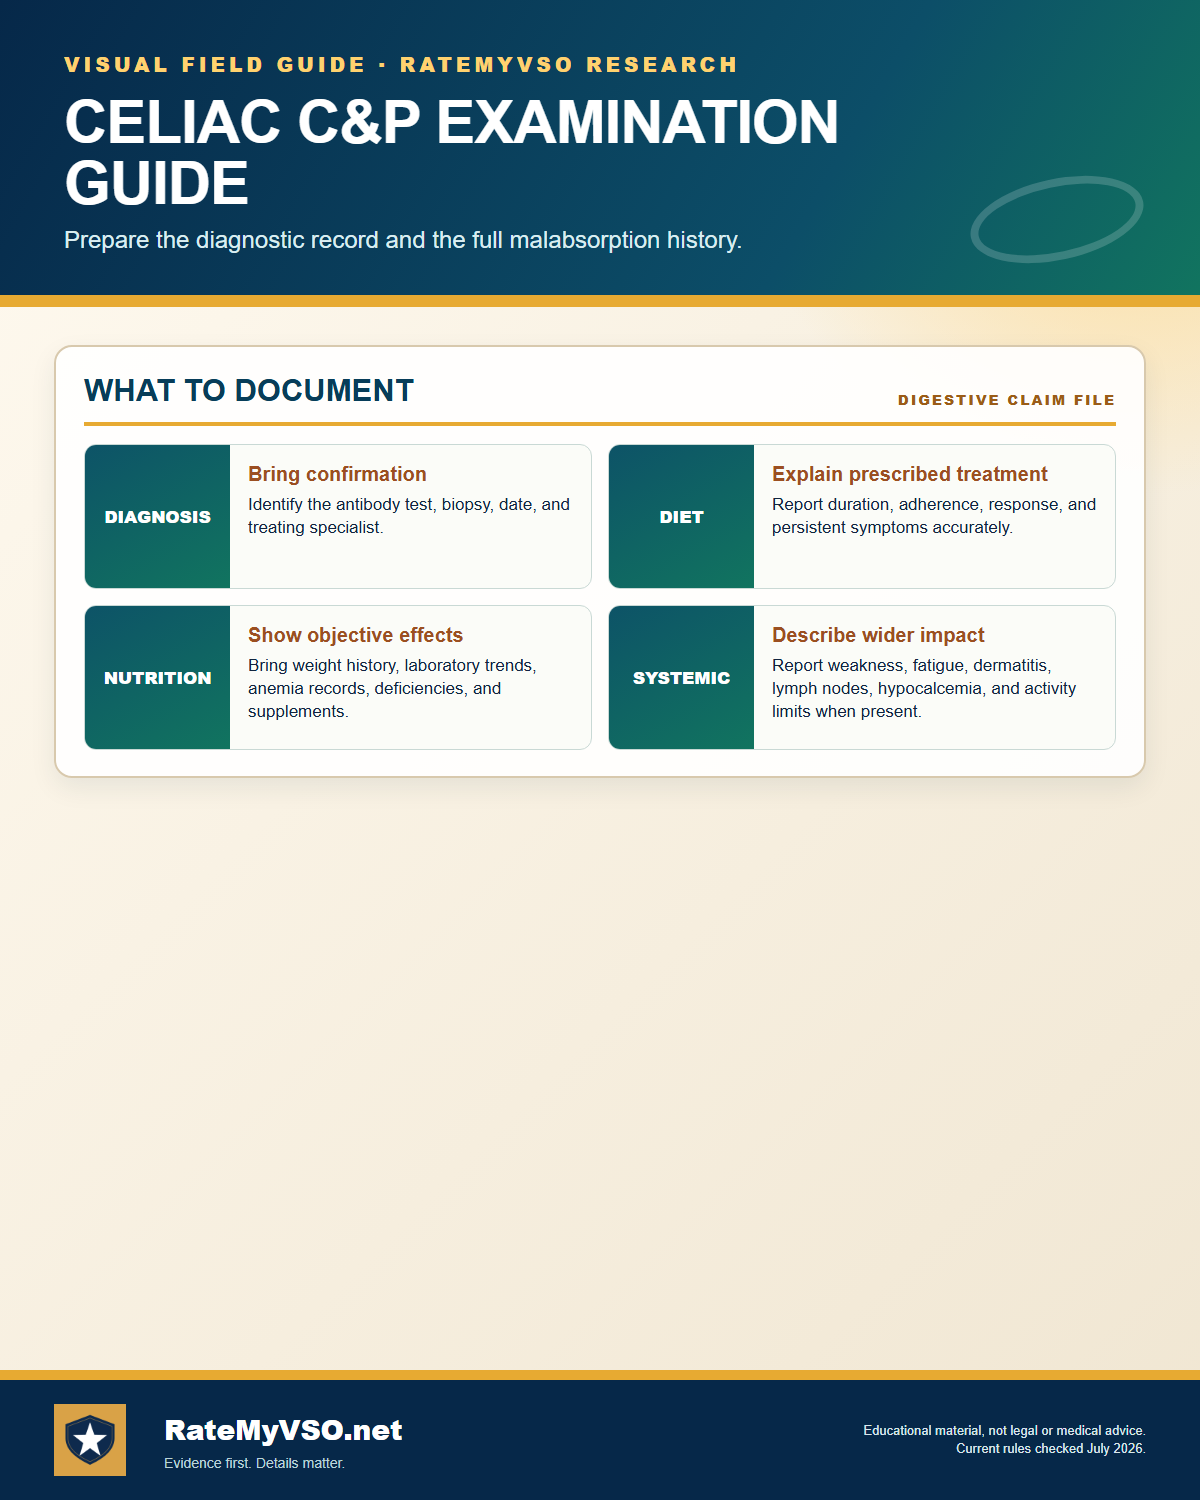
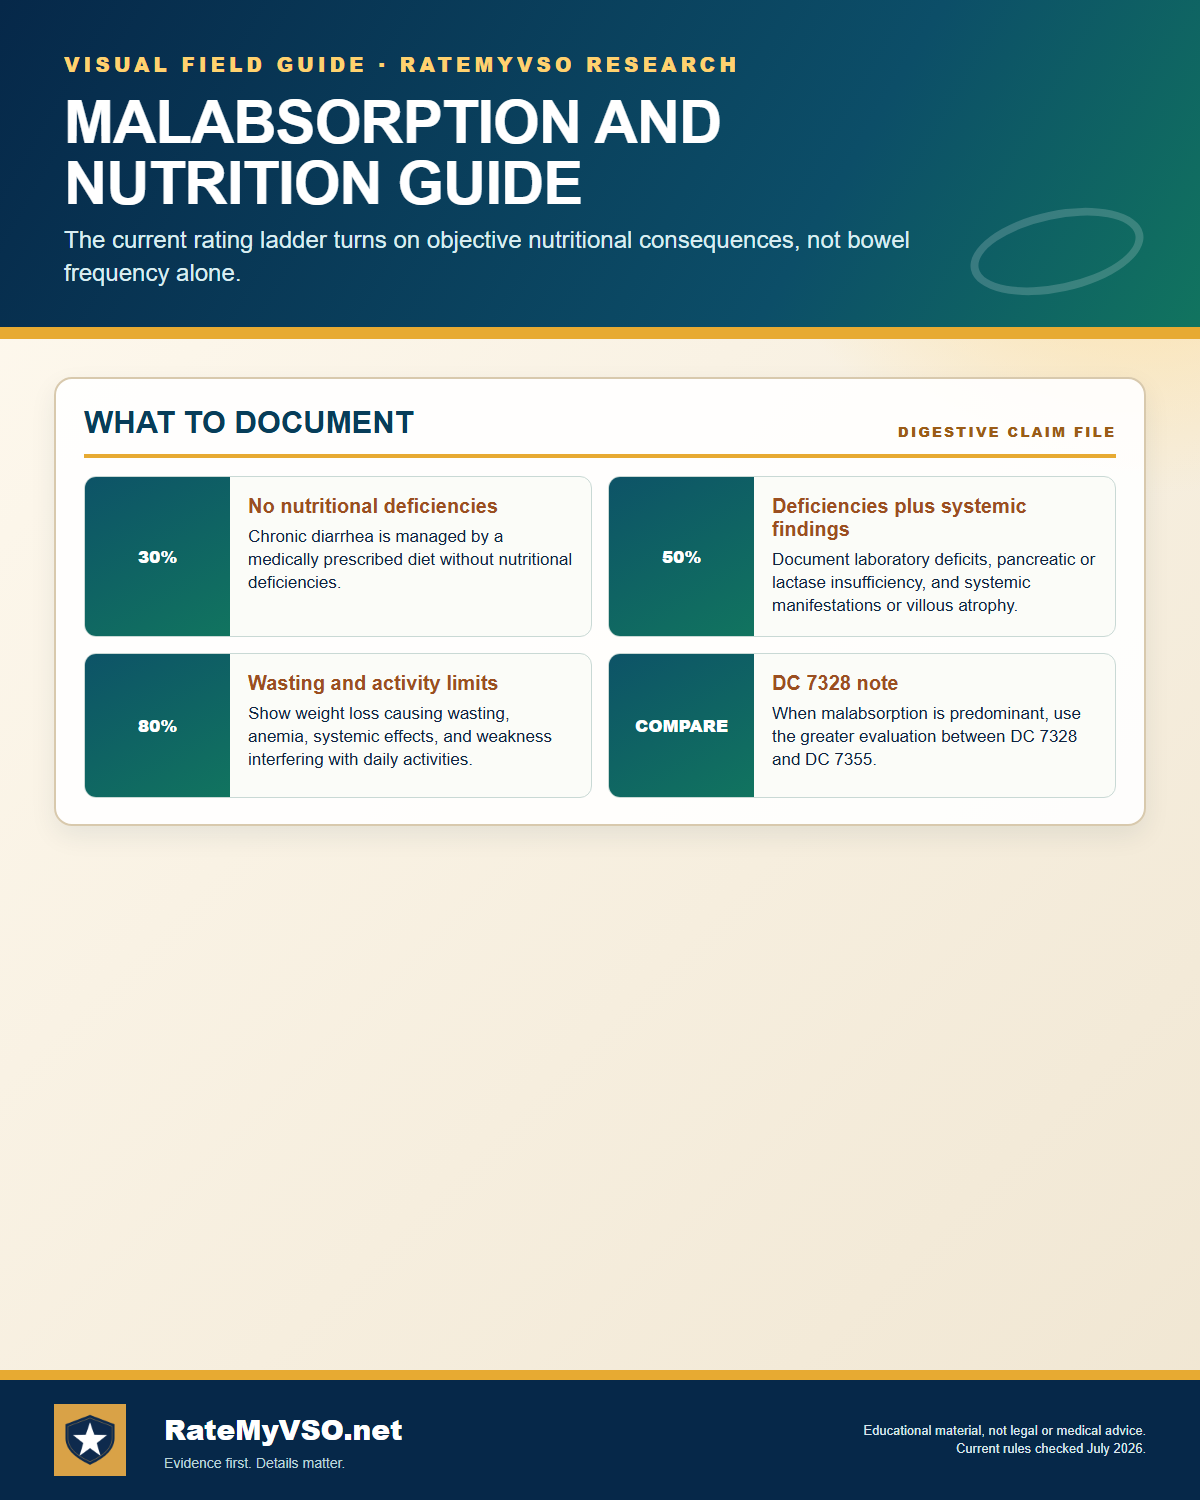
How to use this library
Every guide is a single tall image sized for printing or saving to your phone. Select any card to open the full-resolution image, or use the download link under it. Use the filter to narrow to one condition. The rating and evidence charts summarize the published criteria; the research charts report what RateMyVSO measured in published Board decisions, with the denominator printed on the chart itself.
These charts catalogue the published rating criteria and what appears in published Board decisions. The two conditions keep separate records and are never pooled: the GERD charts count roughly thirty-two thousand decisions and the celiac charts a few hundred, so a combined figure would be the GERD figure wearing a digestive label. That is also why celiac has a research-limits chart in place of a theory comparison. Each research chart names its own denominator, and they are not interchangeable: an outcome share counts all coded issue outcomes including remands, while a denial share counts only classified service-connection denials. A grant rate inside an opinion group describes decided appeals and is not evidence that the opinion caused the outcome, nor a prediction about any individual claim. These charts are not legal or medical advice. For the full written guidance, start with the GERD or celiac disease claims guide.