Hearing Loss and Tinnitus Visual Guide Library
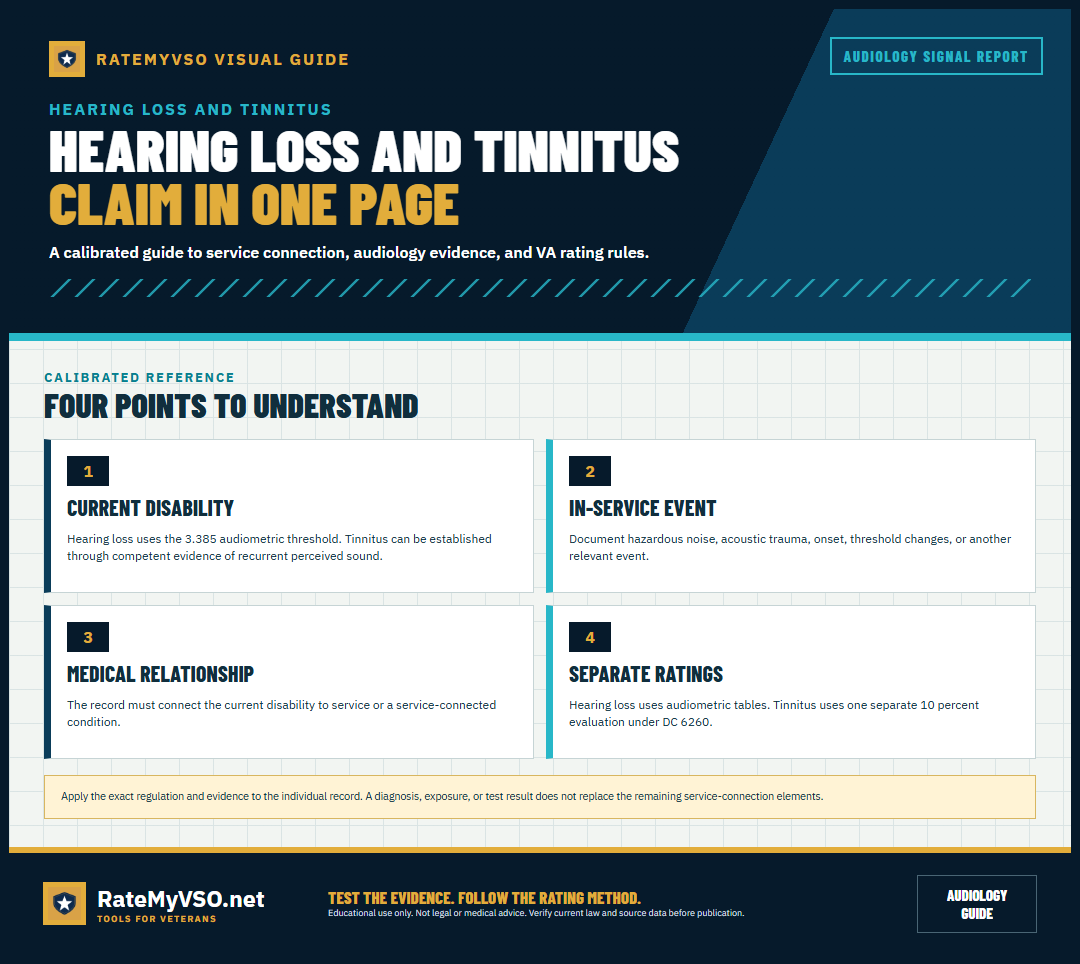
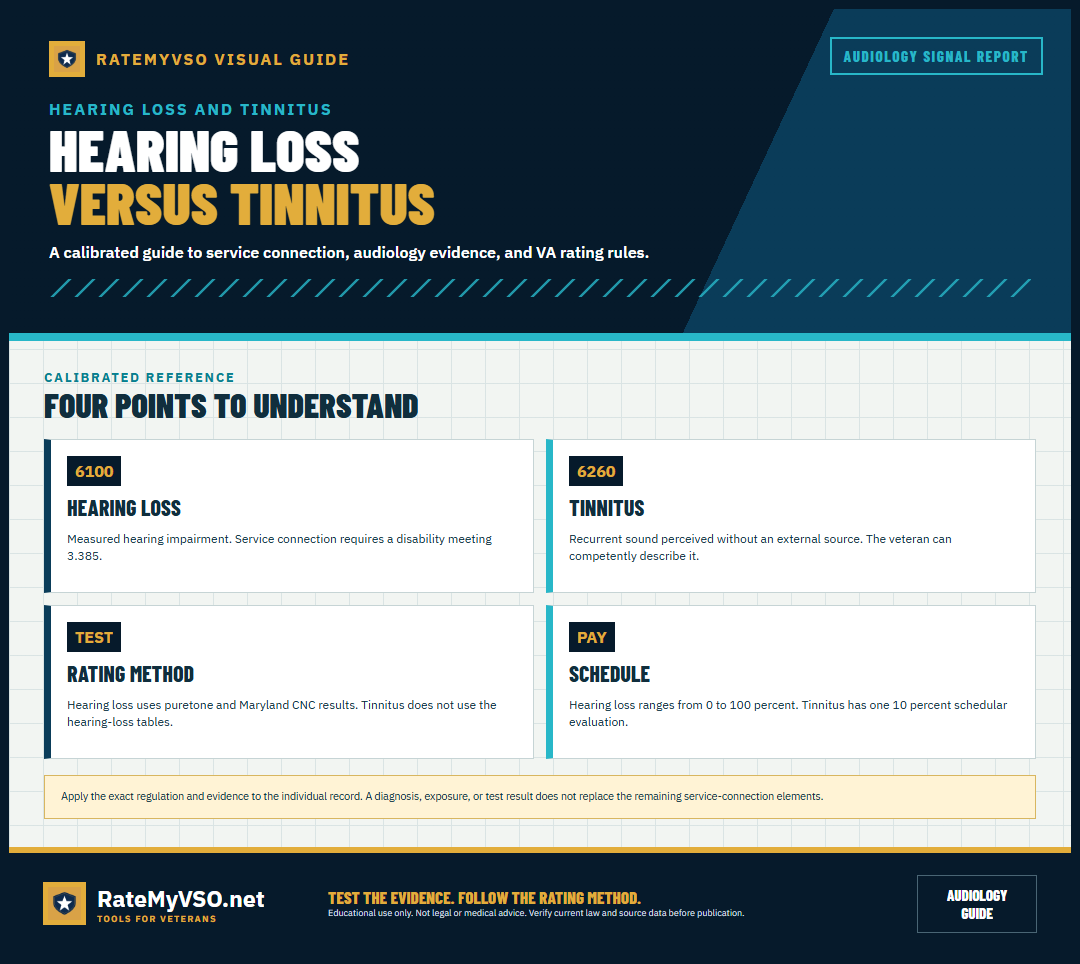
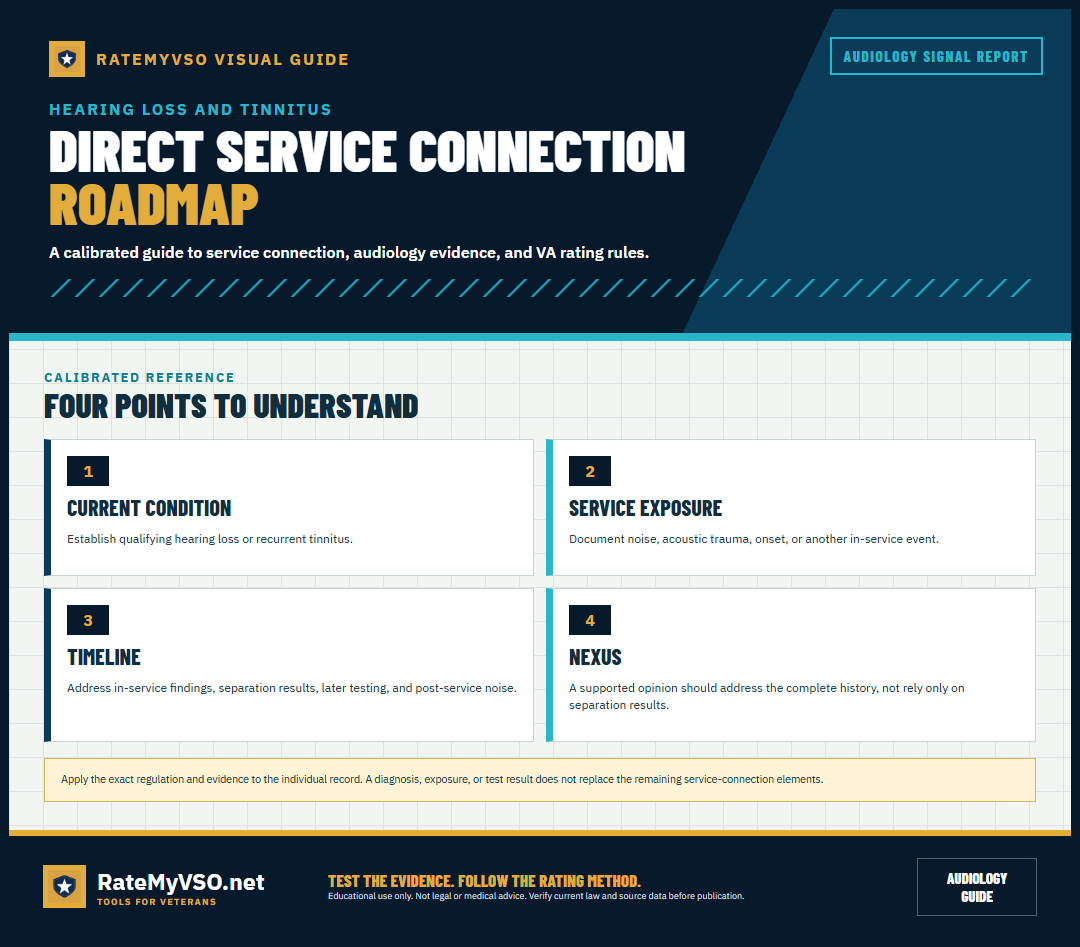
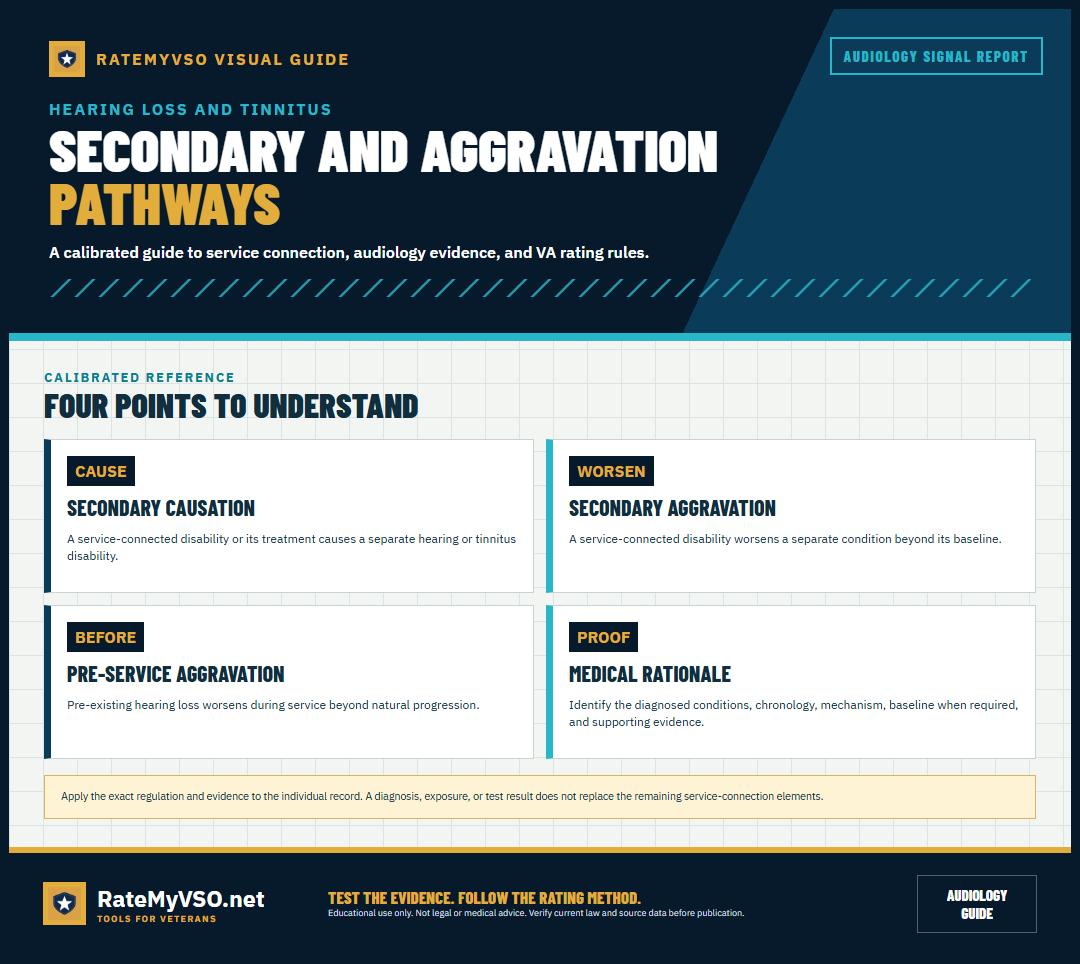
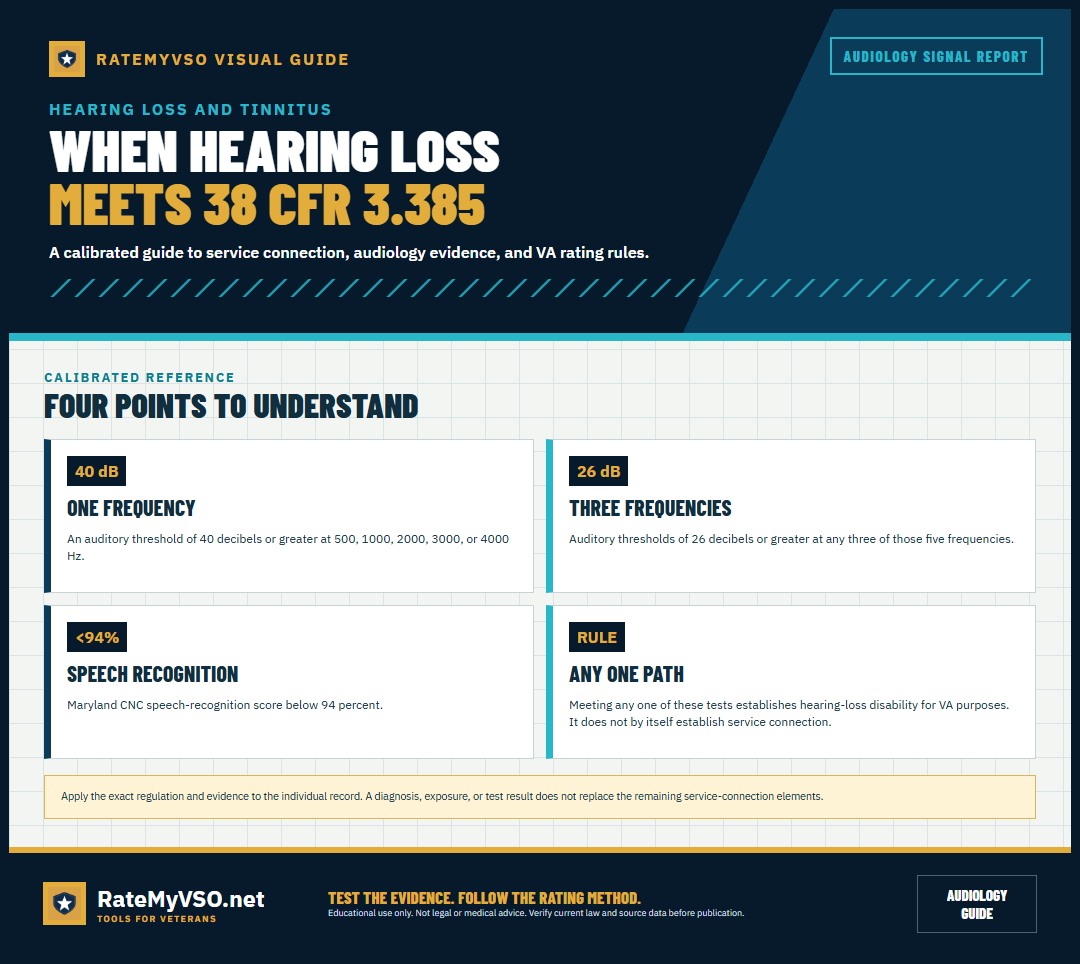
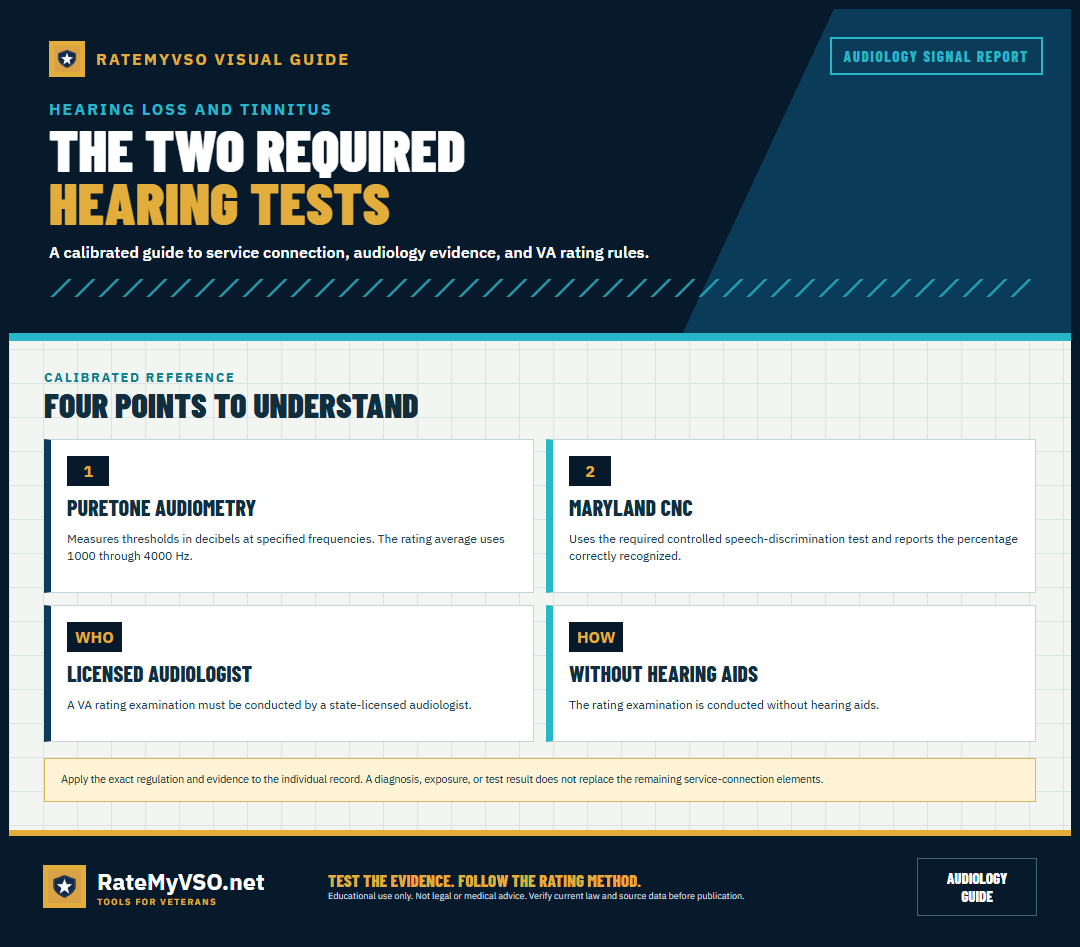
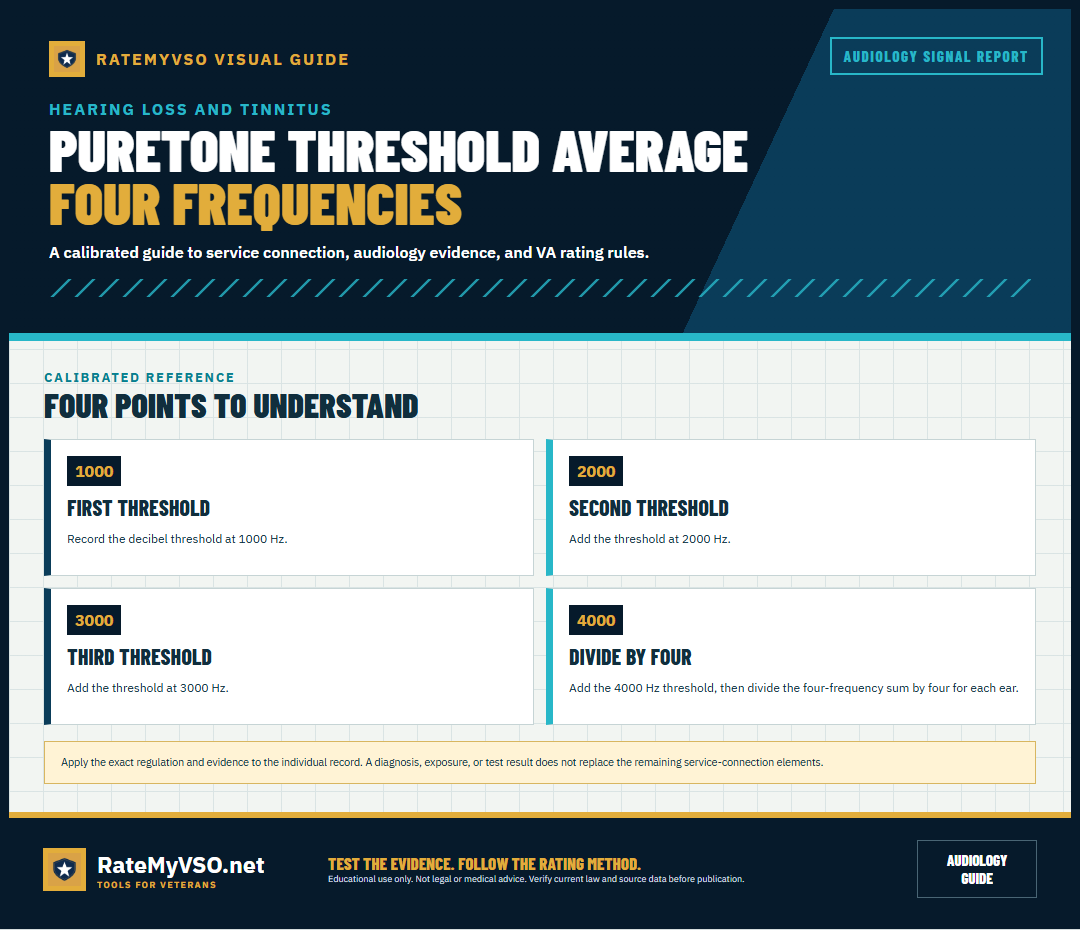
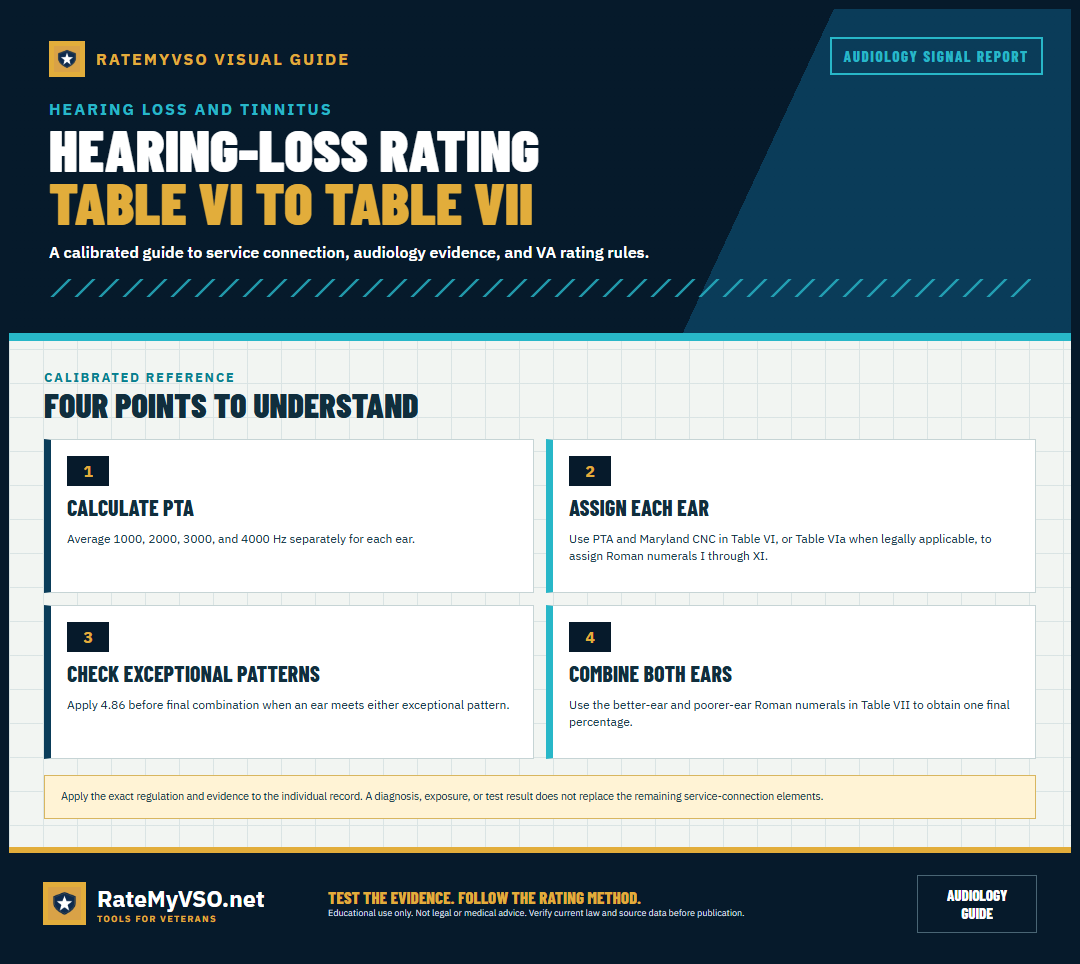
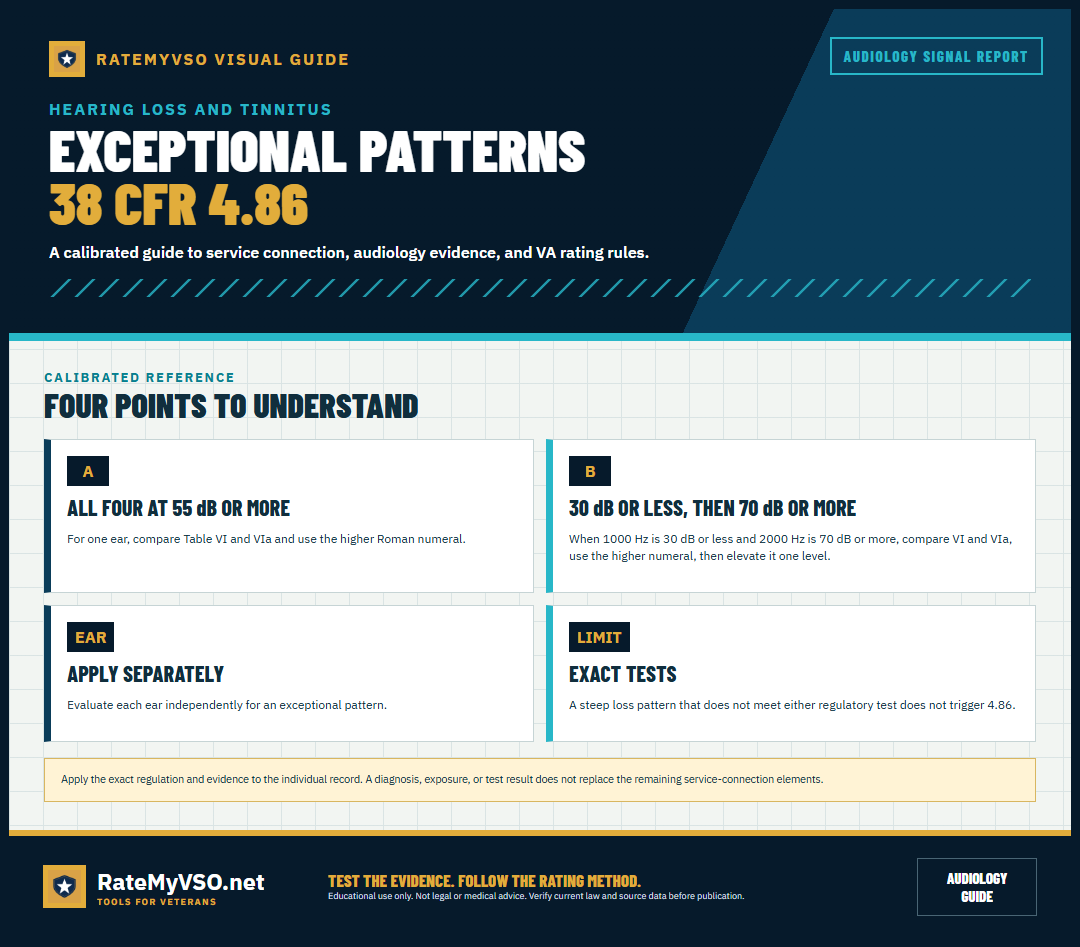
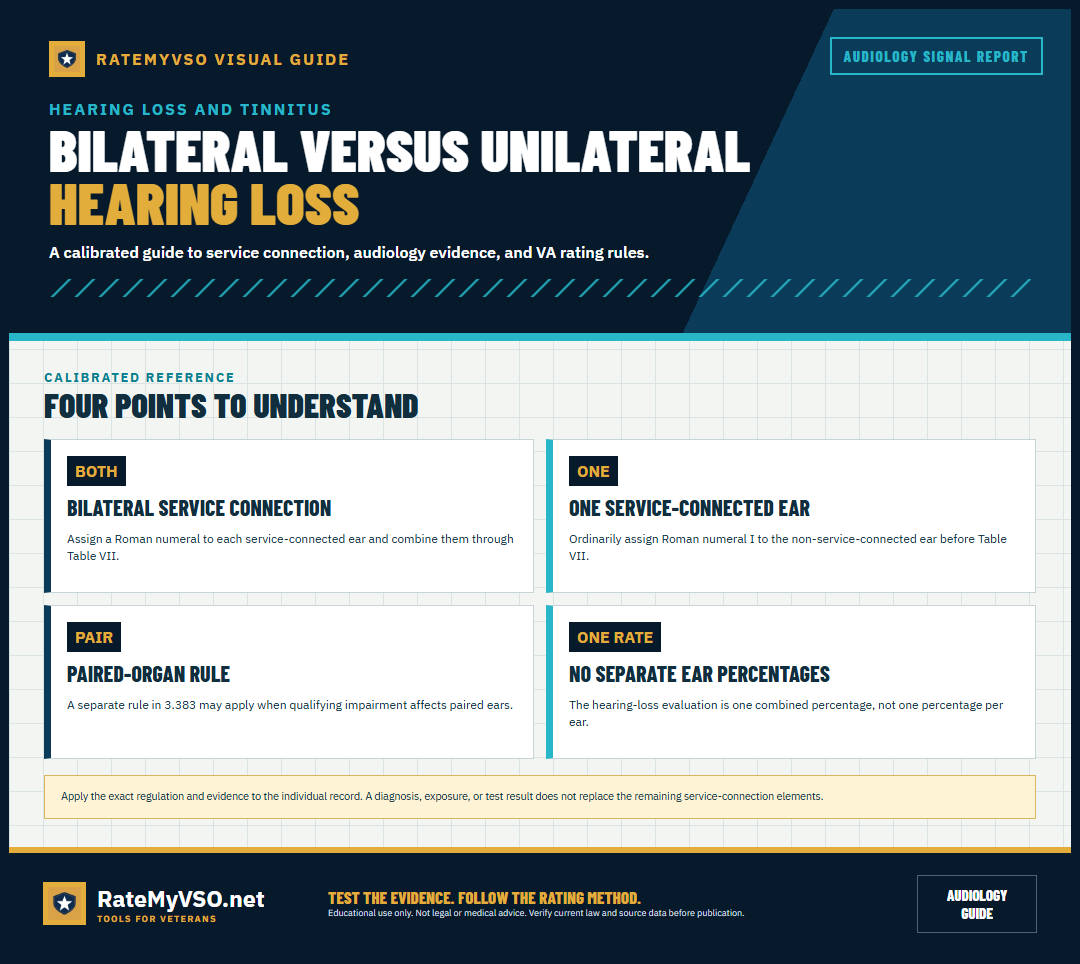
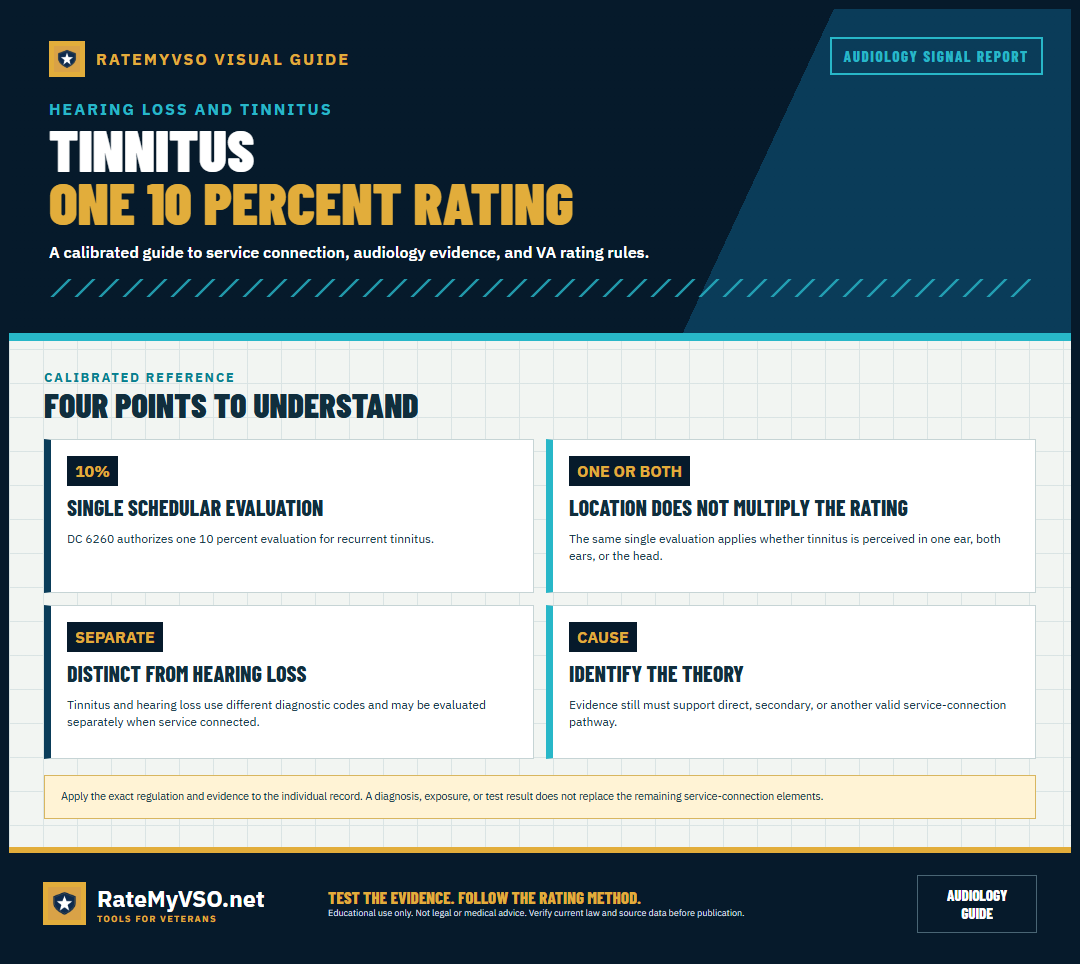
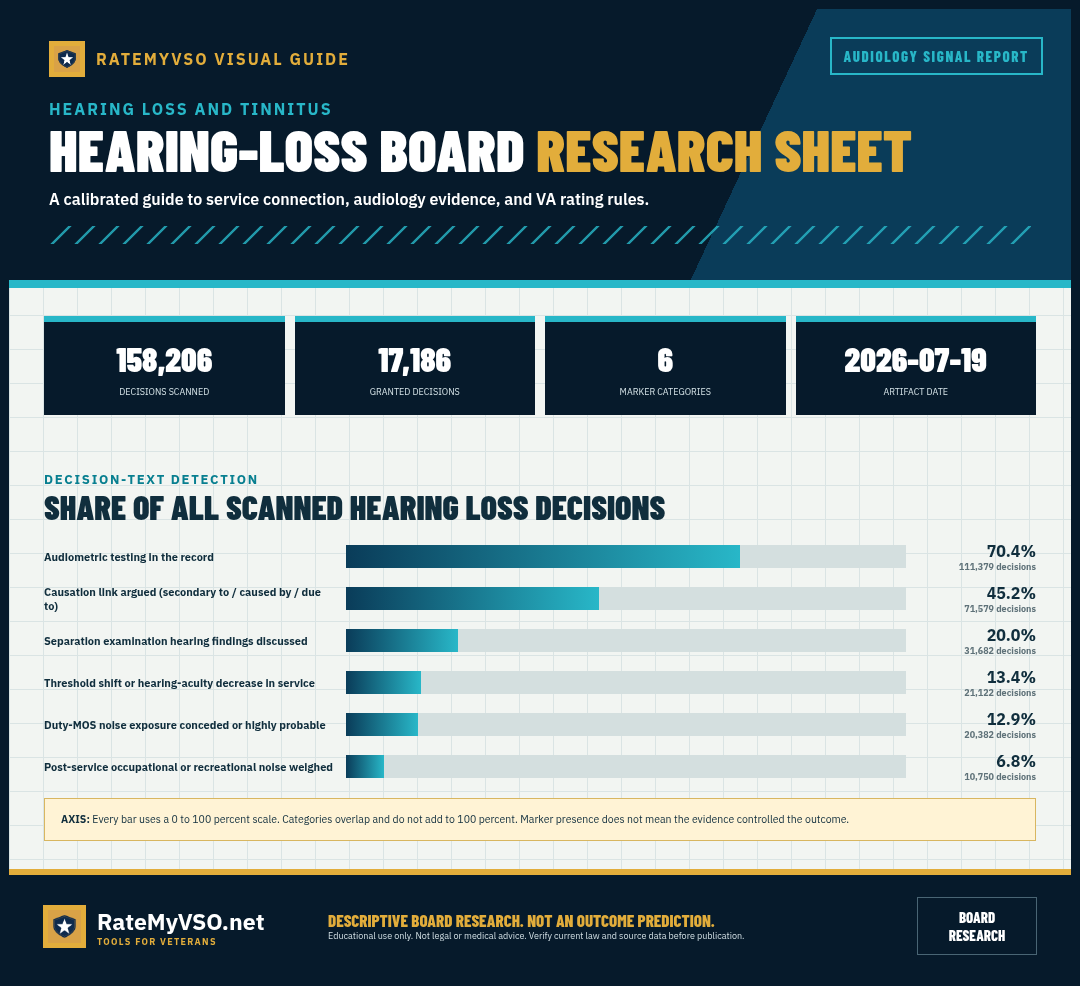
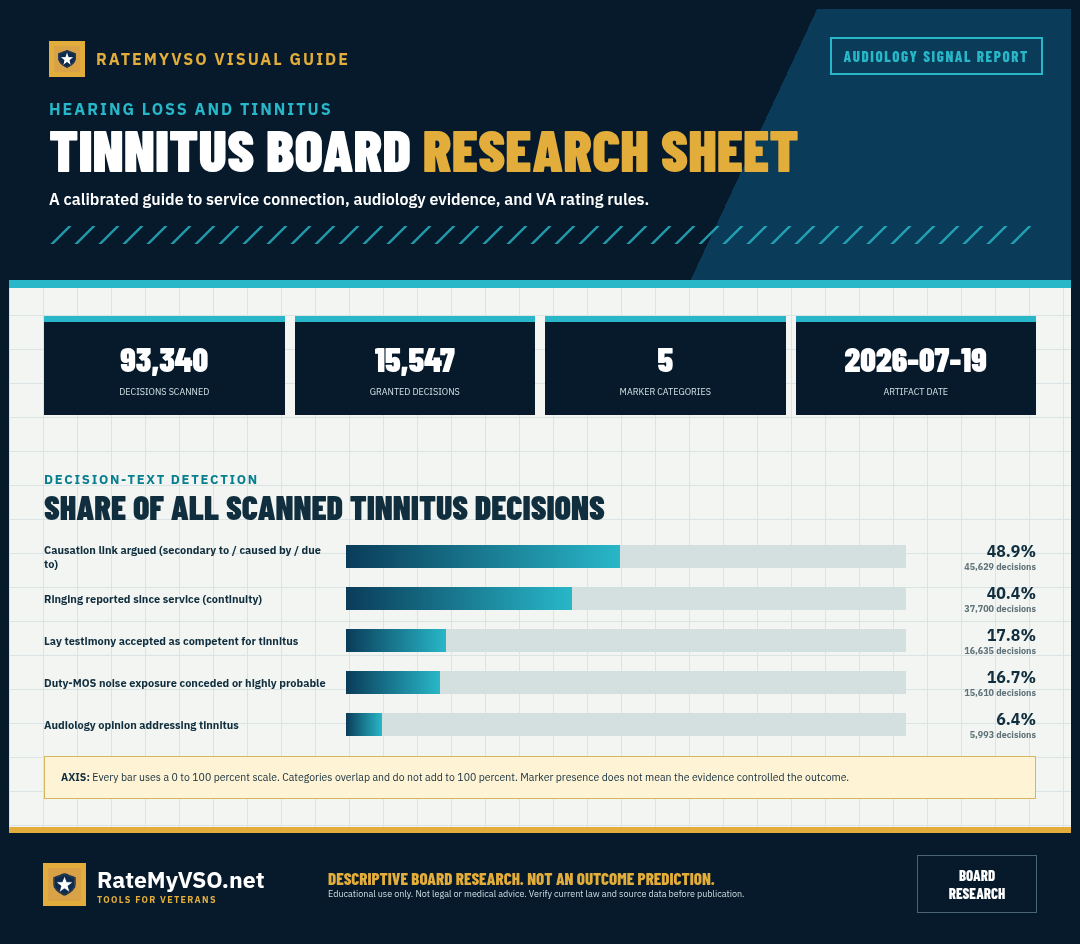
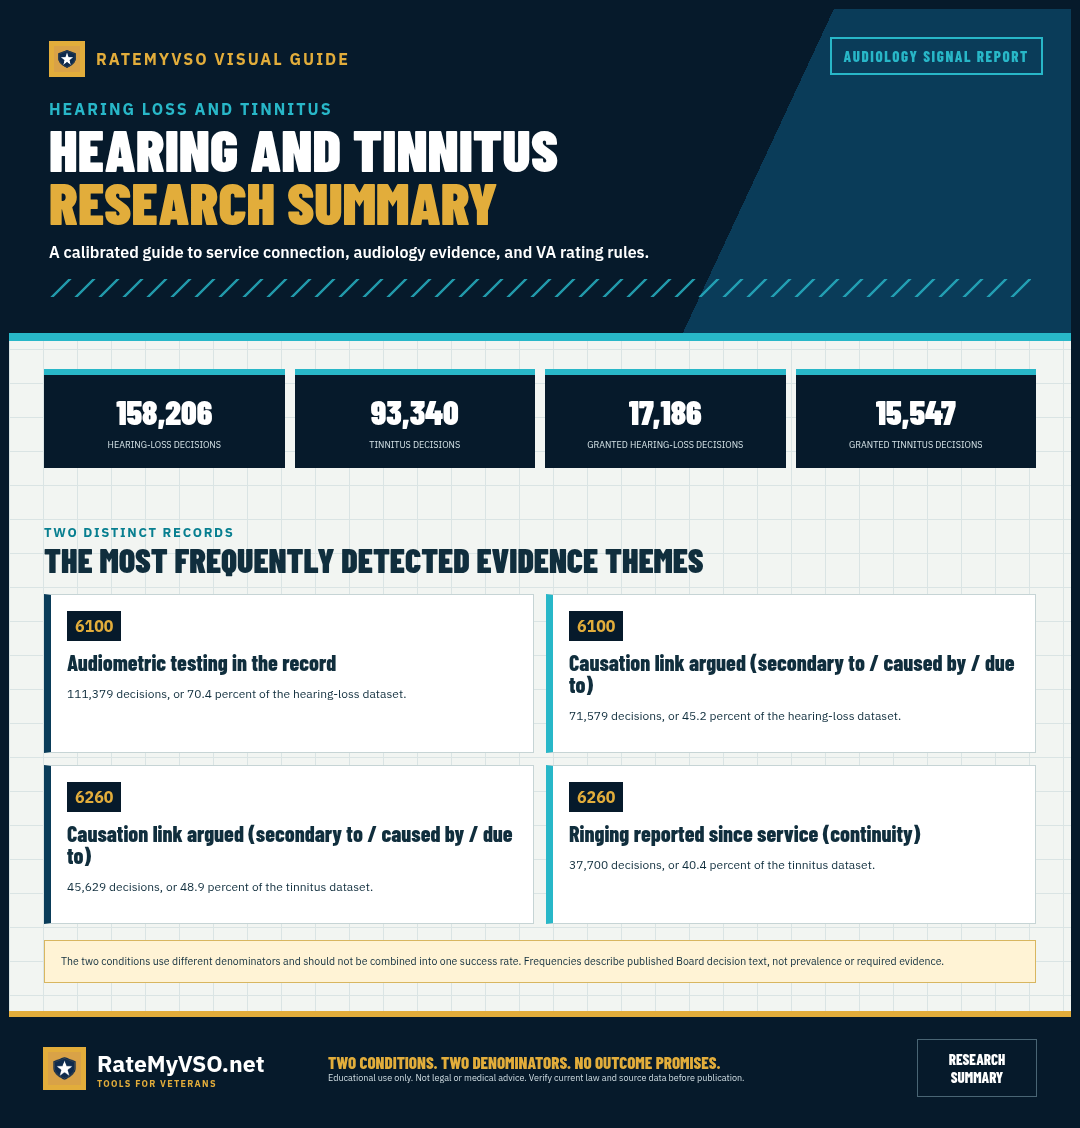
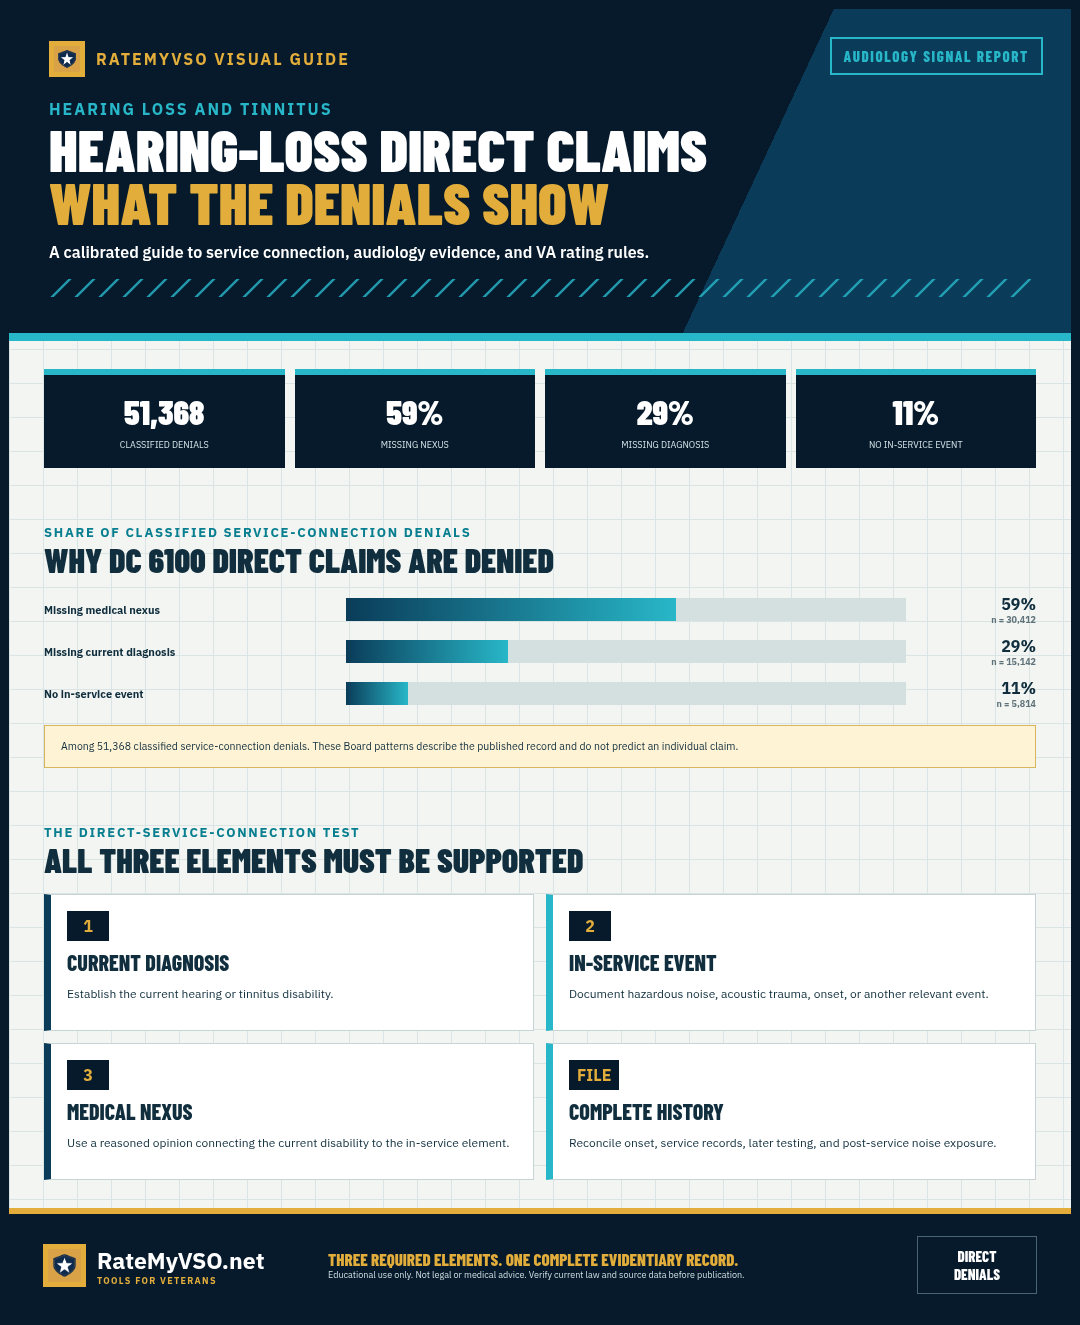
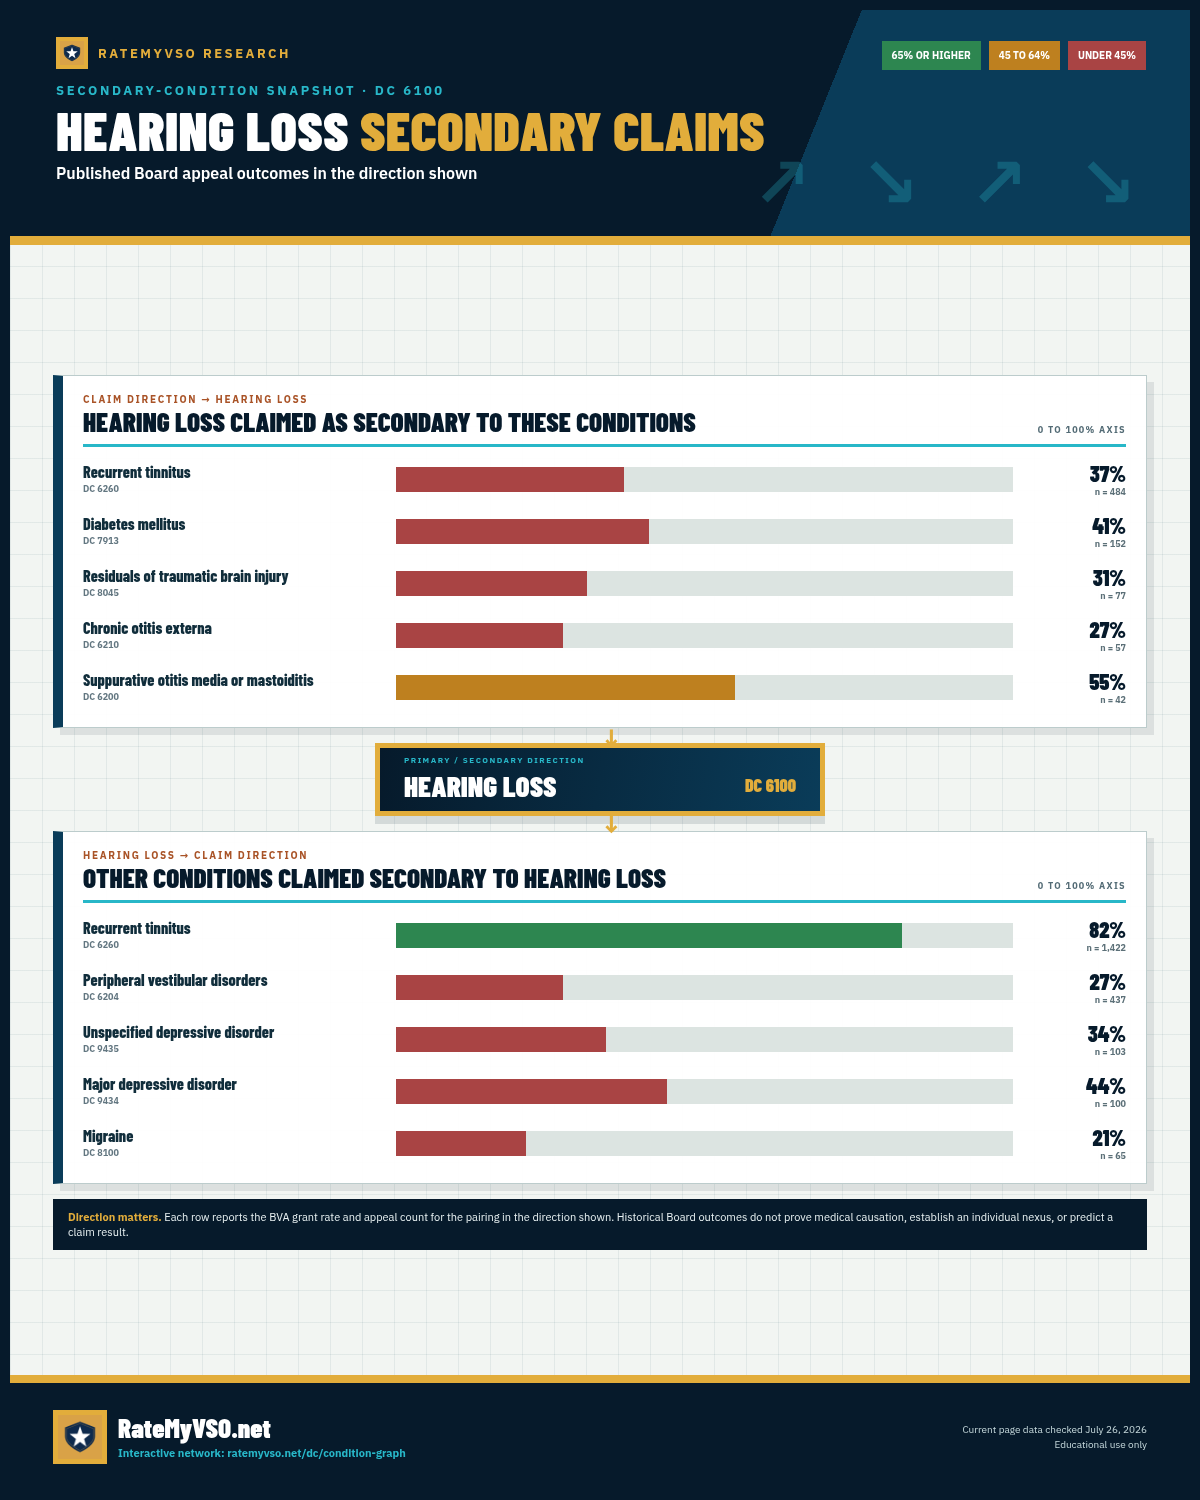
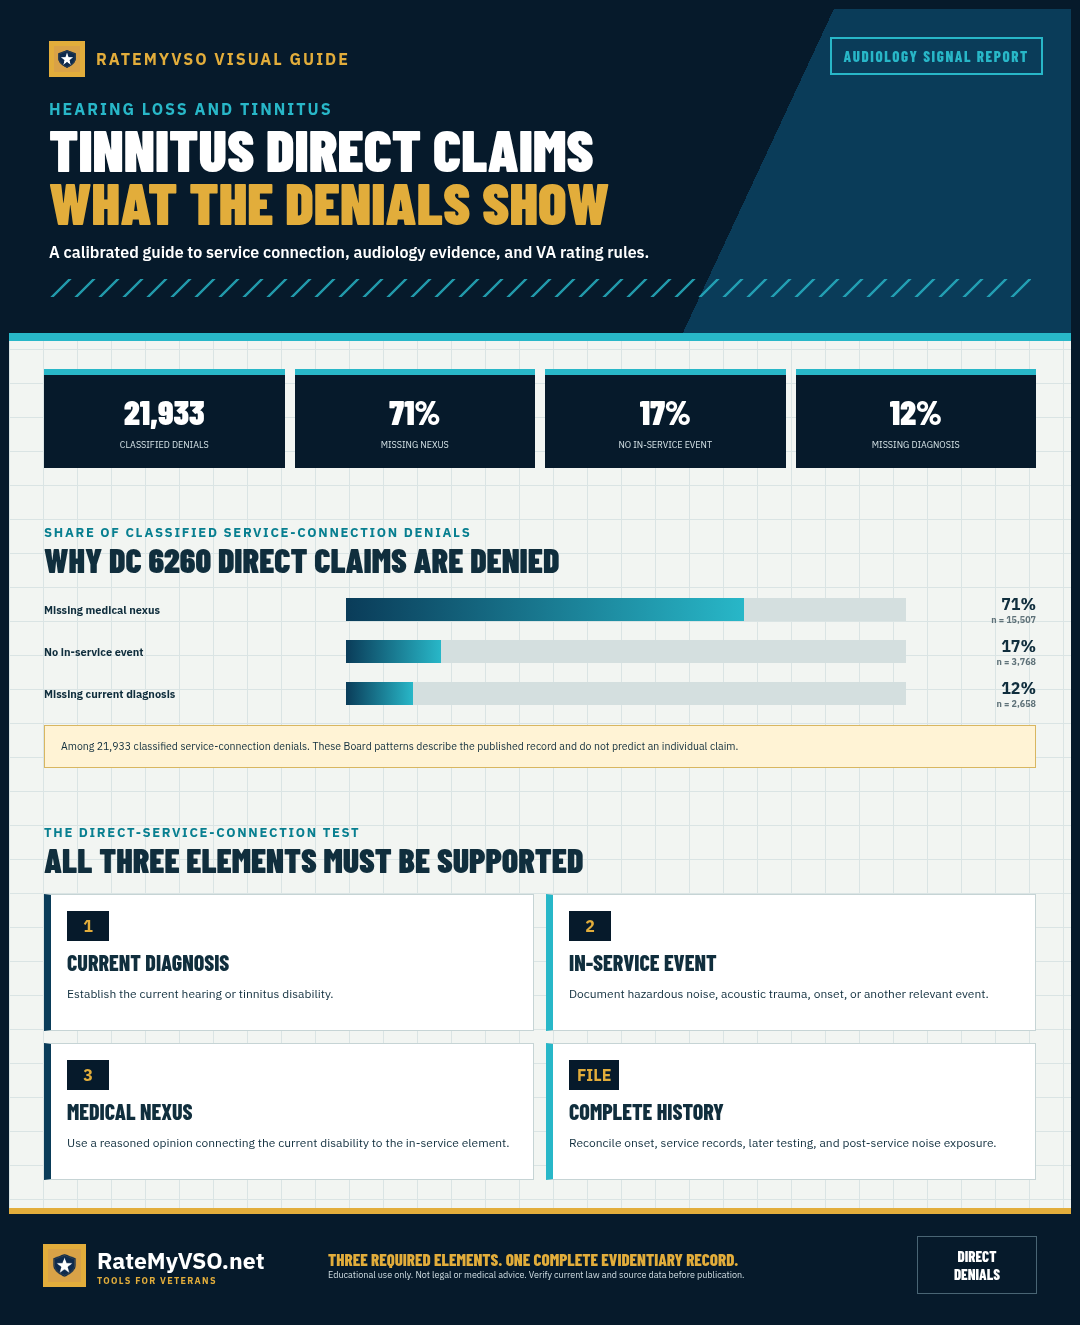
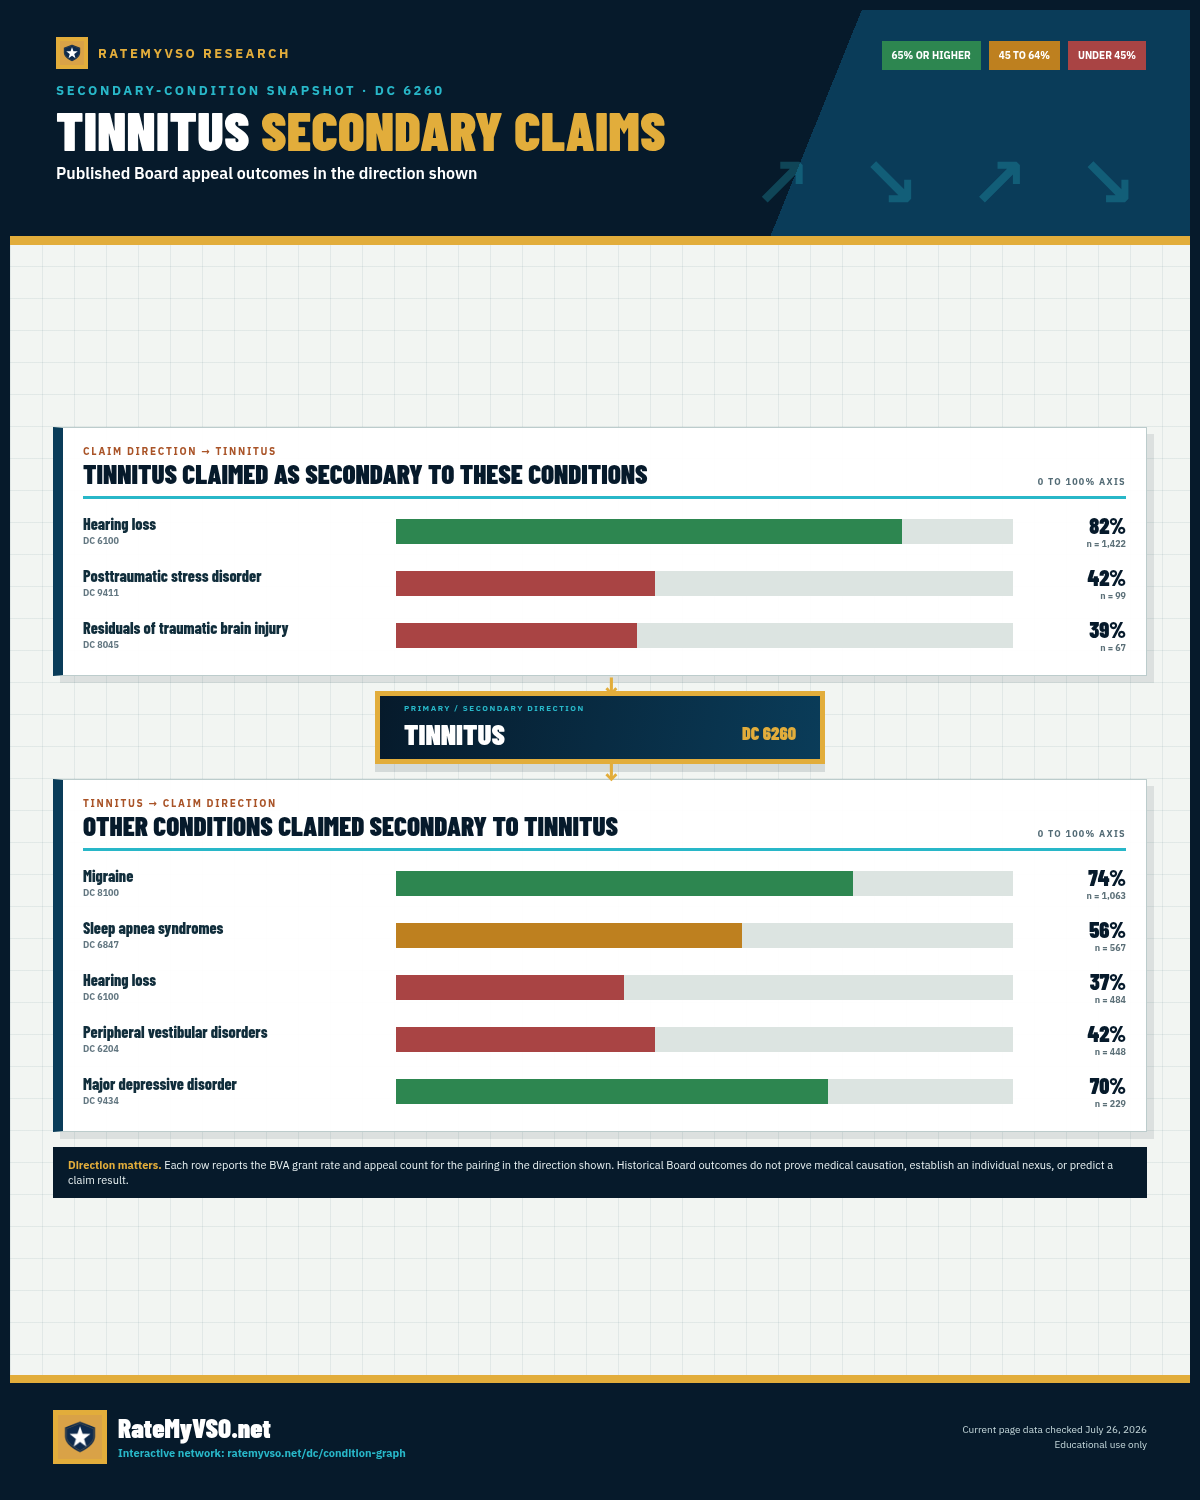
23 printable one-page charts that catalogue how VA hearing loss and tinnitus claims work: when measured hearing meets the disability threshold in 38 CFR 3.385, the two tests VA requires, how the puretone average is calculated, how Table VI and Table VII turn test results into a percentage, the exceptional patterns under 38 CFR 4.86, why a service-connected ear can still rate 0 percent, the single 10 percent rating for tinnitus under DC 6260, and research on the evidence themes that appear in published Board decisions.
All 23 visual guides
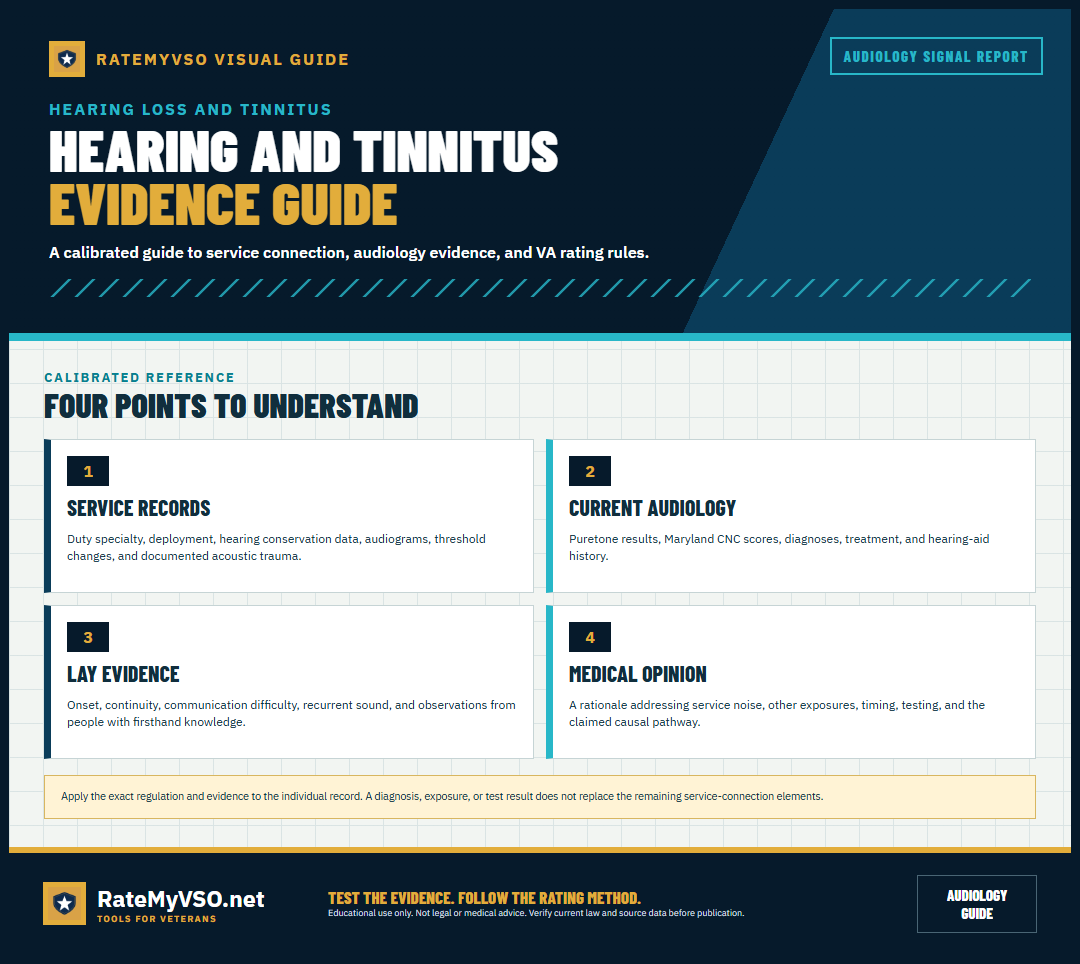
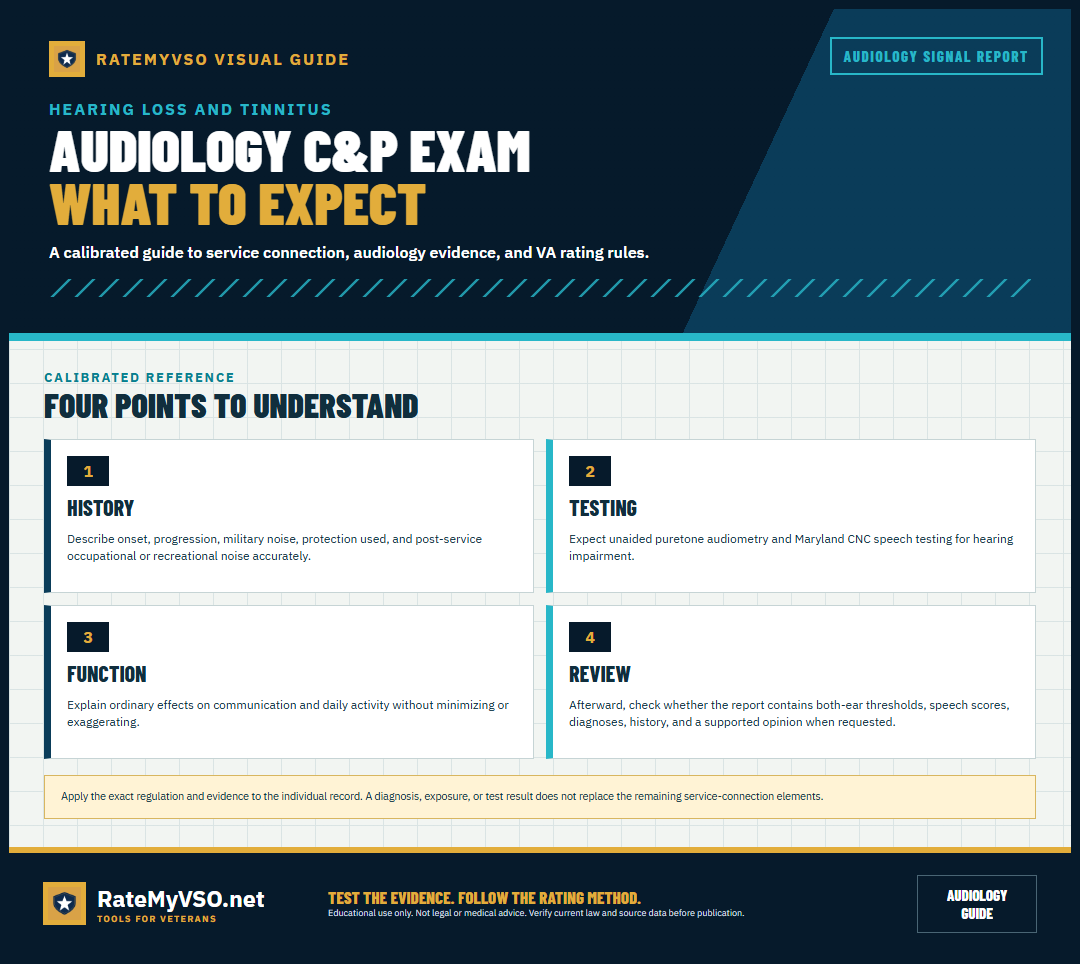
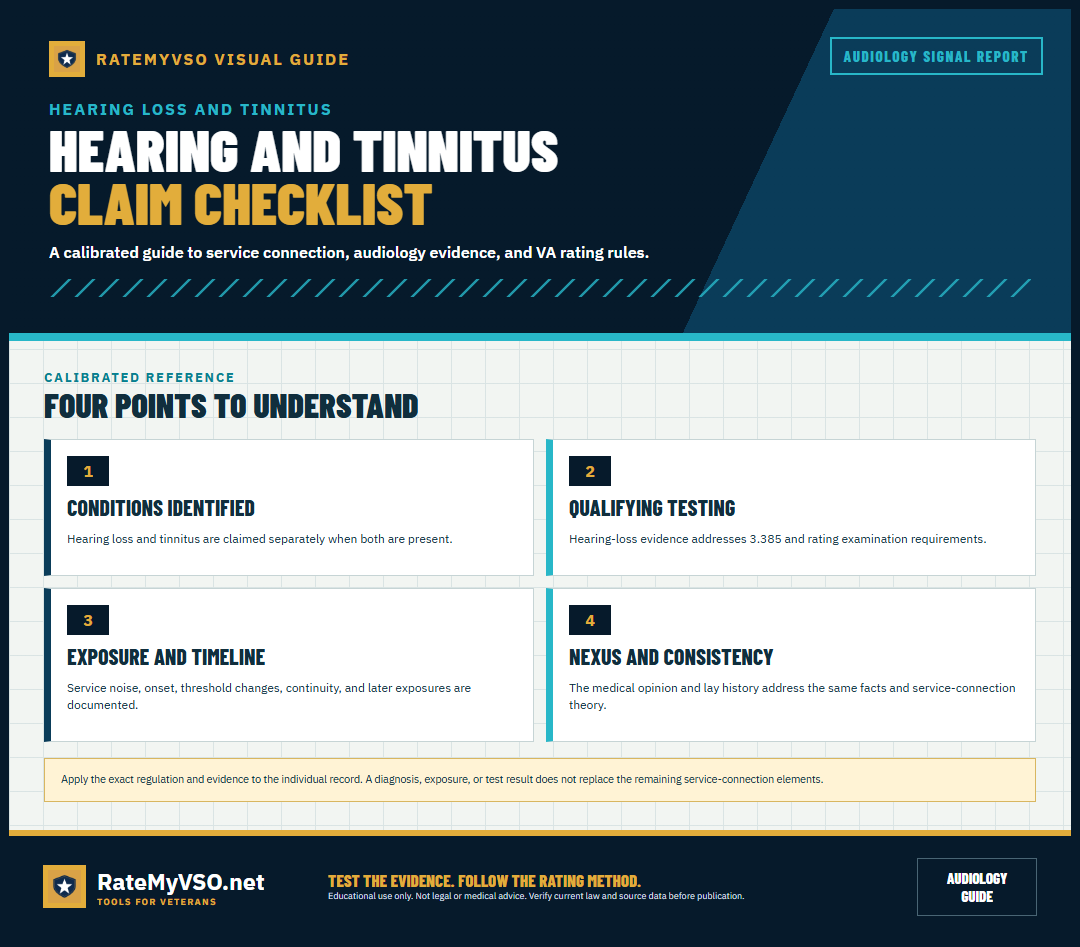
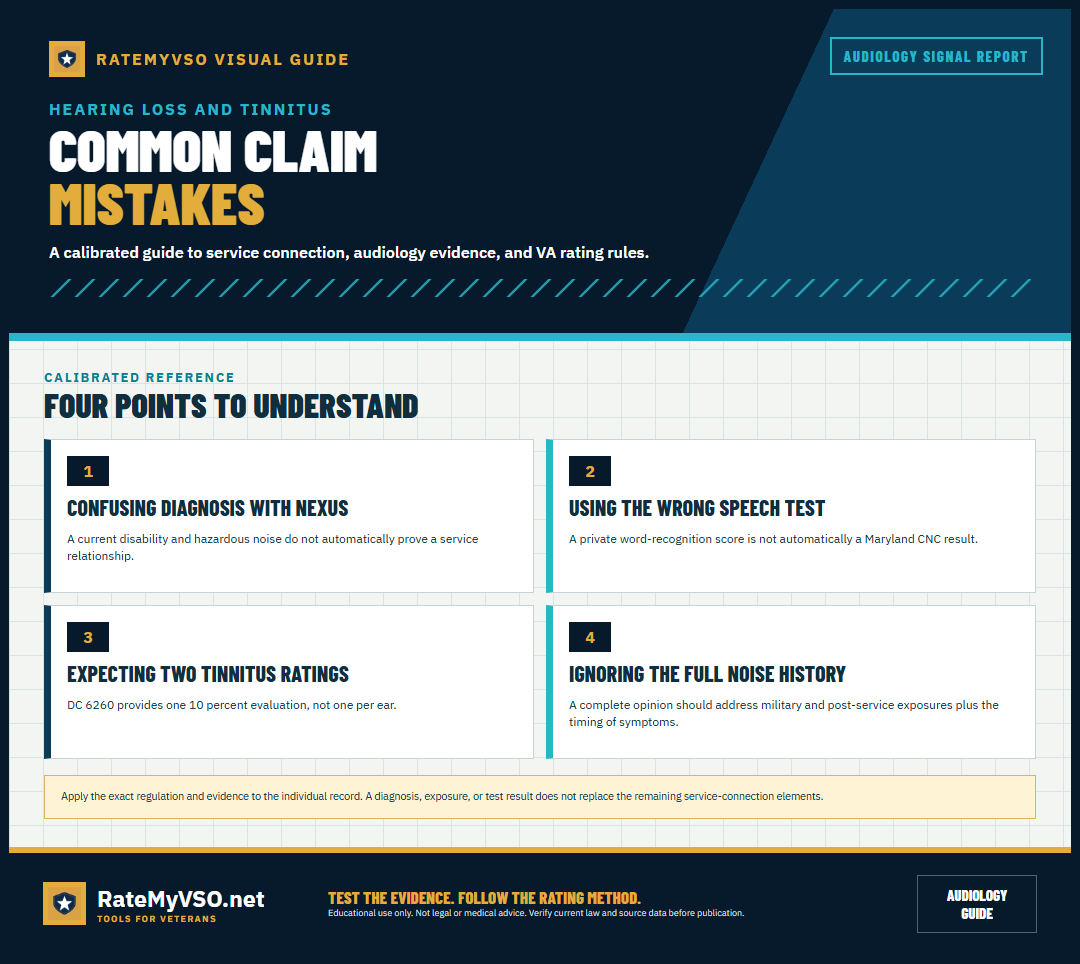
How to use this library
Every guide is a single tall image sized for printing or saving to your phone. Select any card to open the full-resolution image, or use the download link under it. The rule and testing charts summarize the published criteria; the research charts report how often certain evidence themes appeared in published Board decisions, with the population and data date printed on the chart itself.
These charts catalogue published rules and what appears in published Board decisions. Hearing loss and tinnitus are kept separate throughout, with their own denominators, and are never combined into a single success rate. The research figures count how often an evidence theme was detected in decision text; they are not prevalence, not a required checklist, and not a prediction about any individual claim. These charts are not legal or medical advice. For the full written guidance behind them, start with the hearing loss and tinnitus guide.