Migraine Visual Guide Library
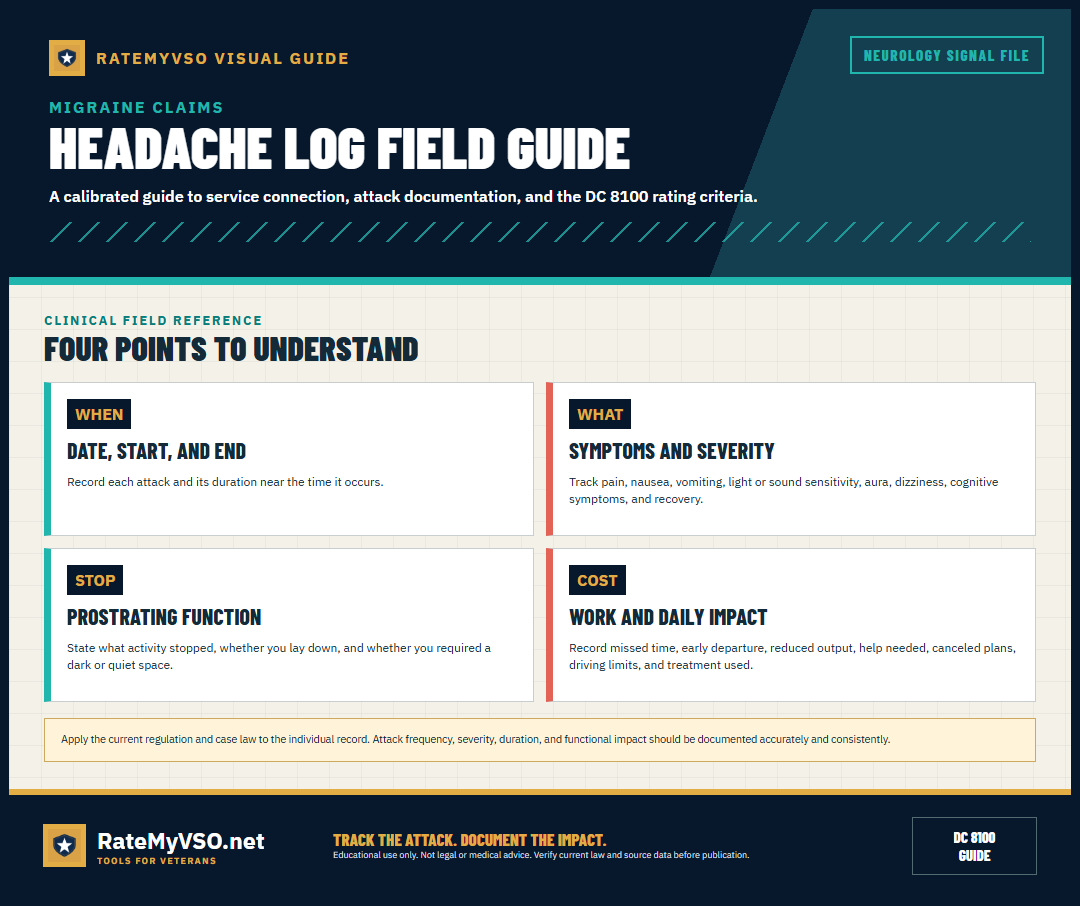
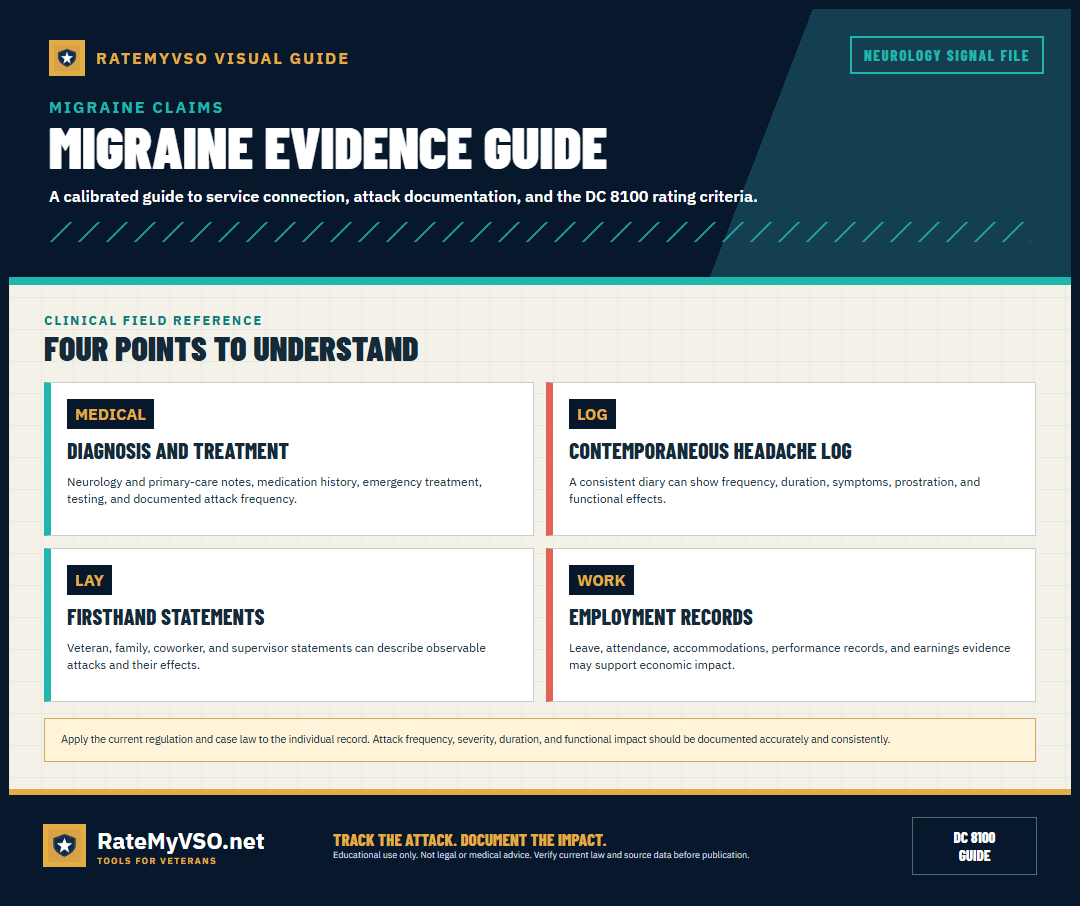
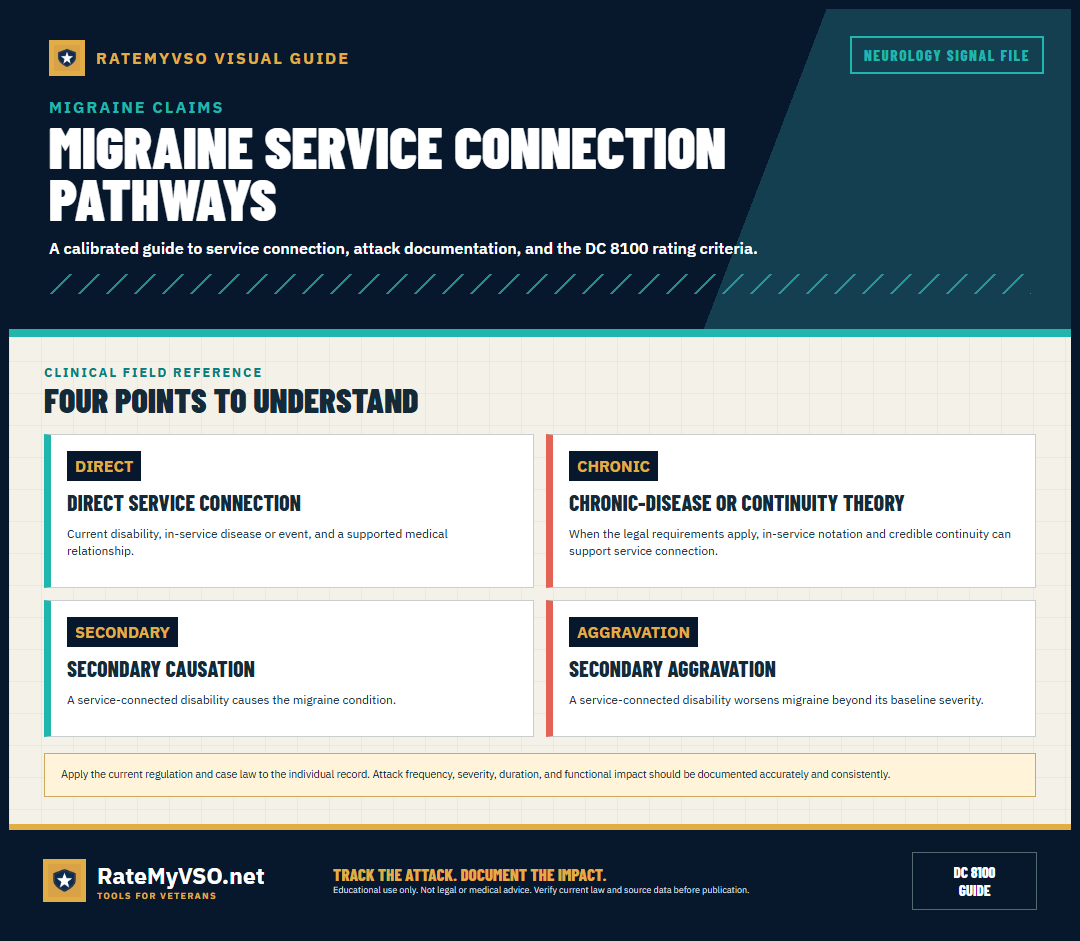
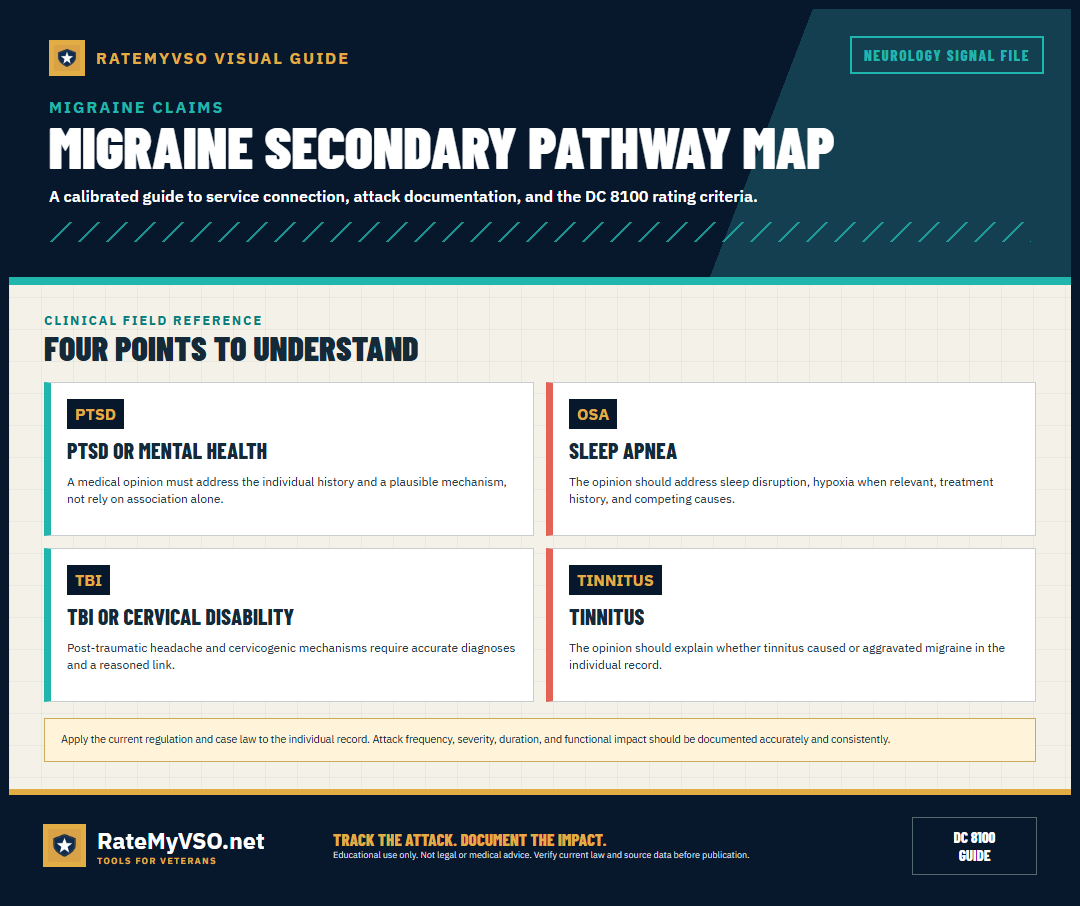
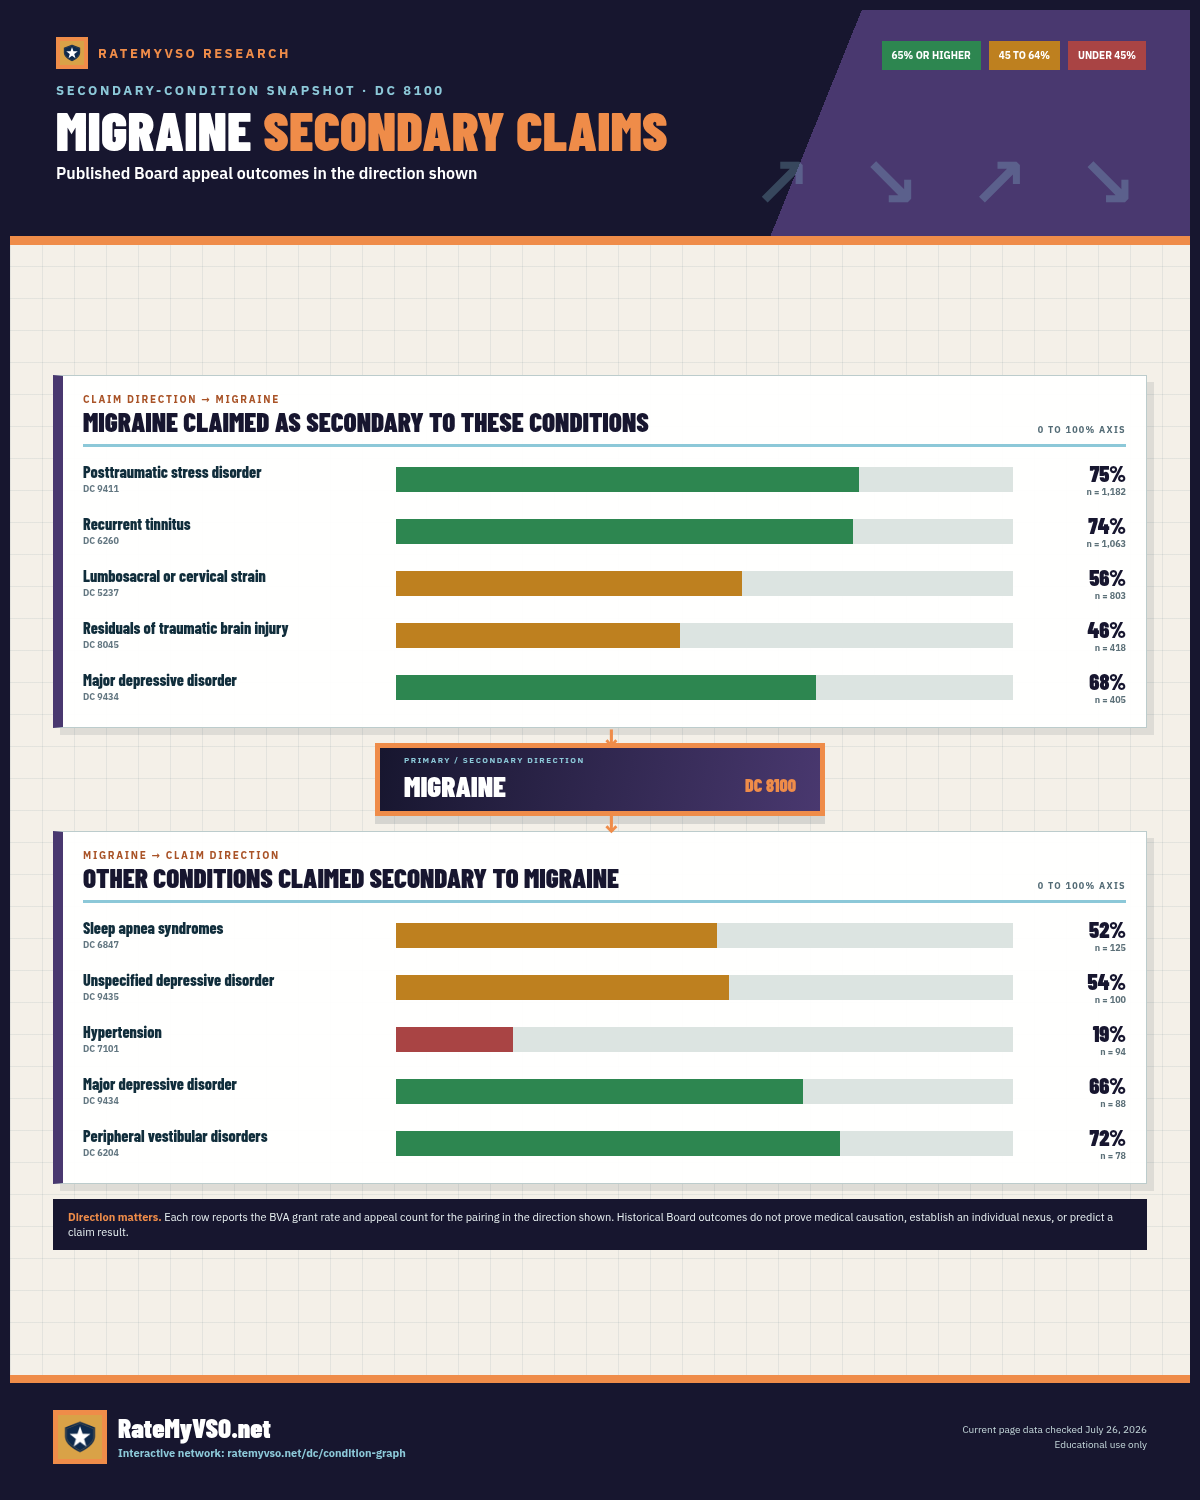
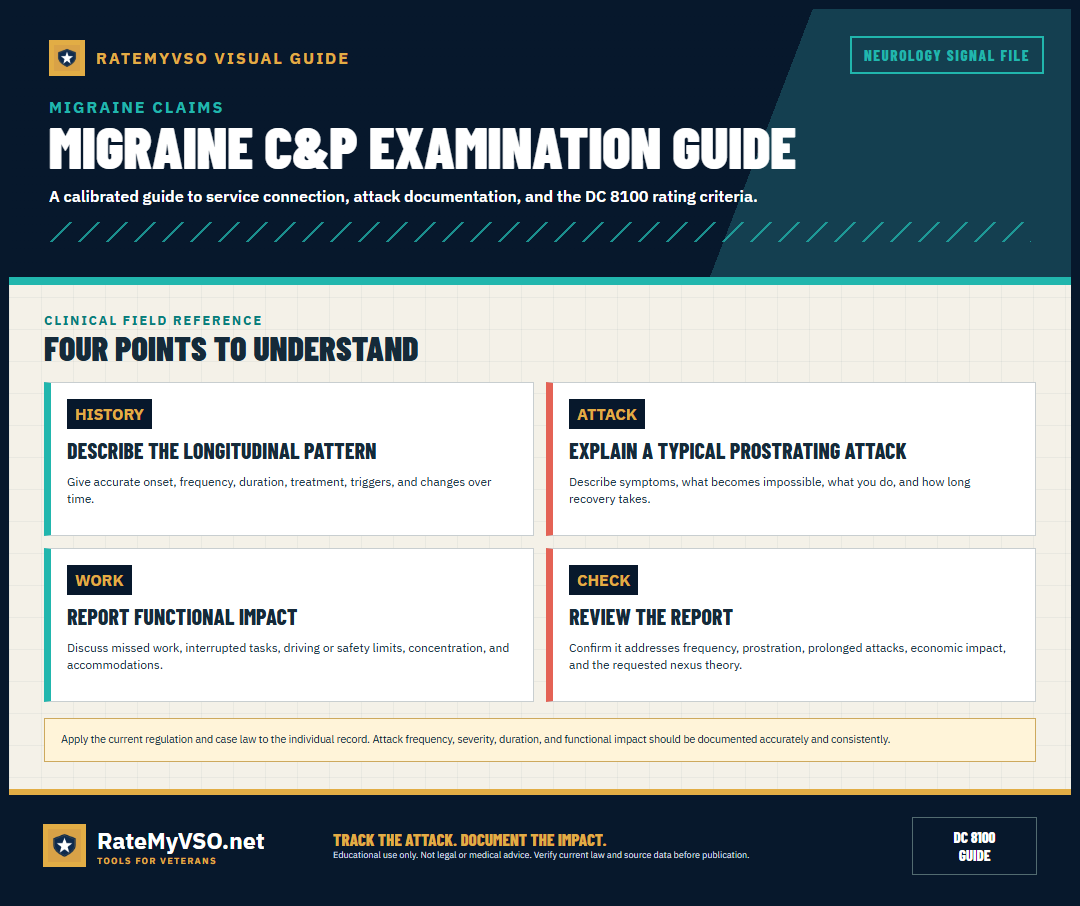
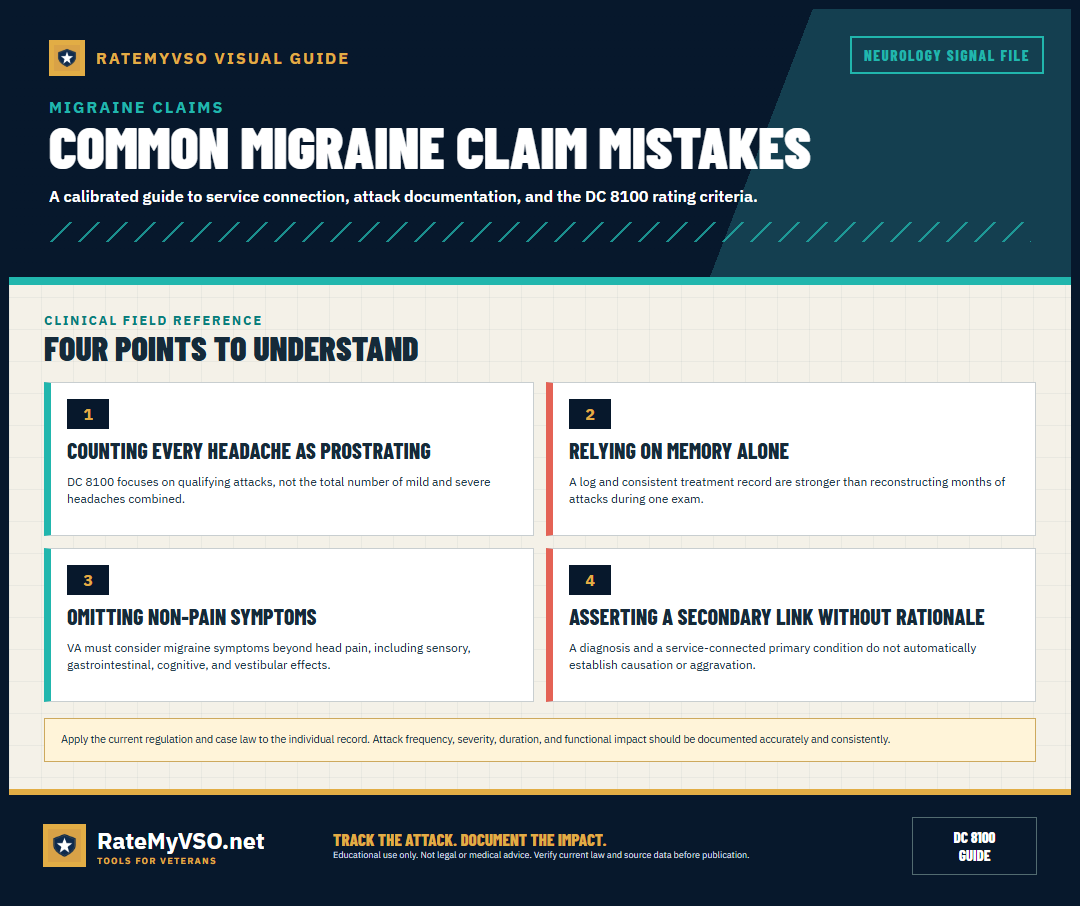
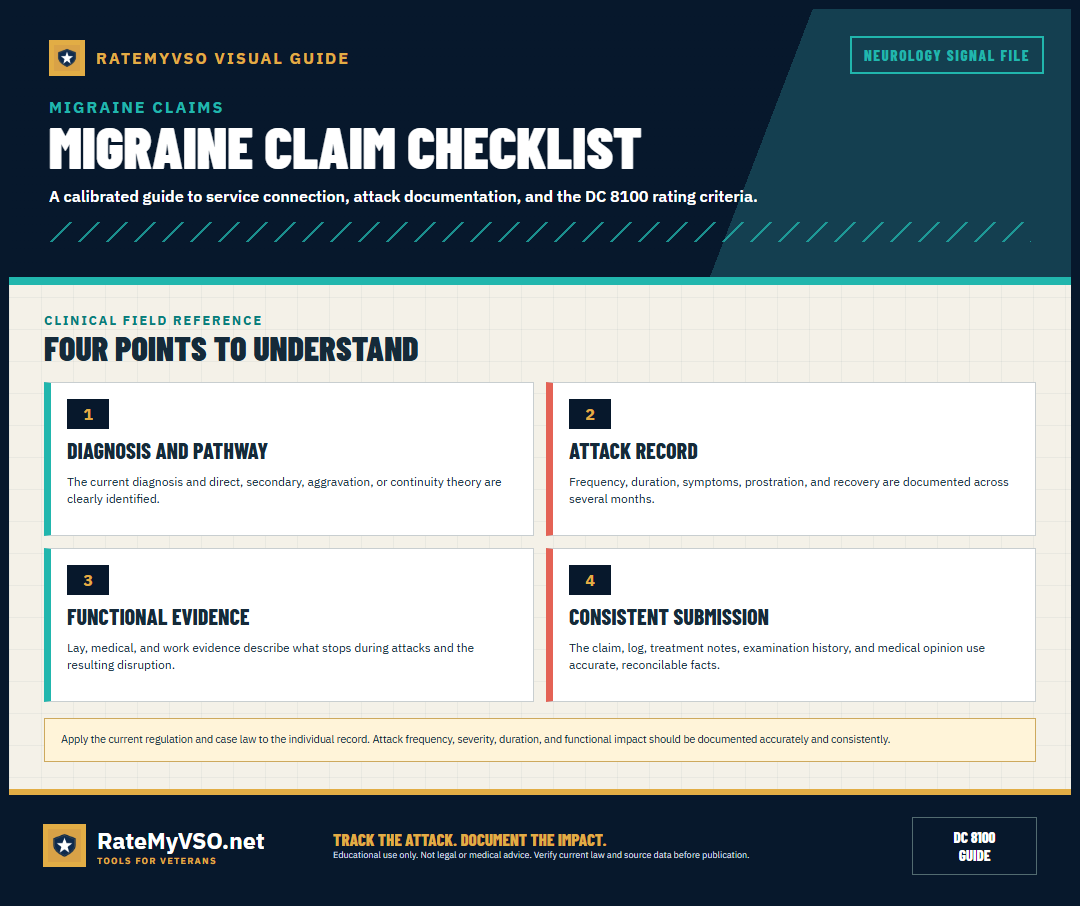
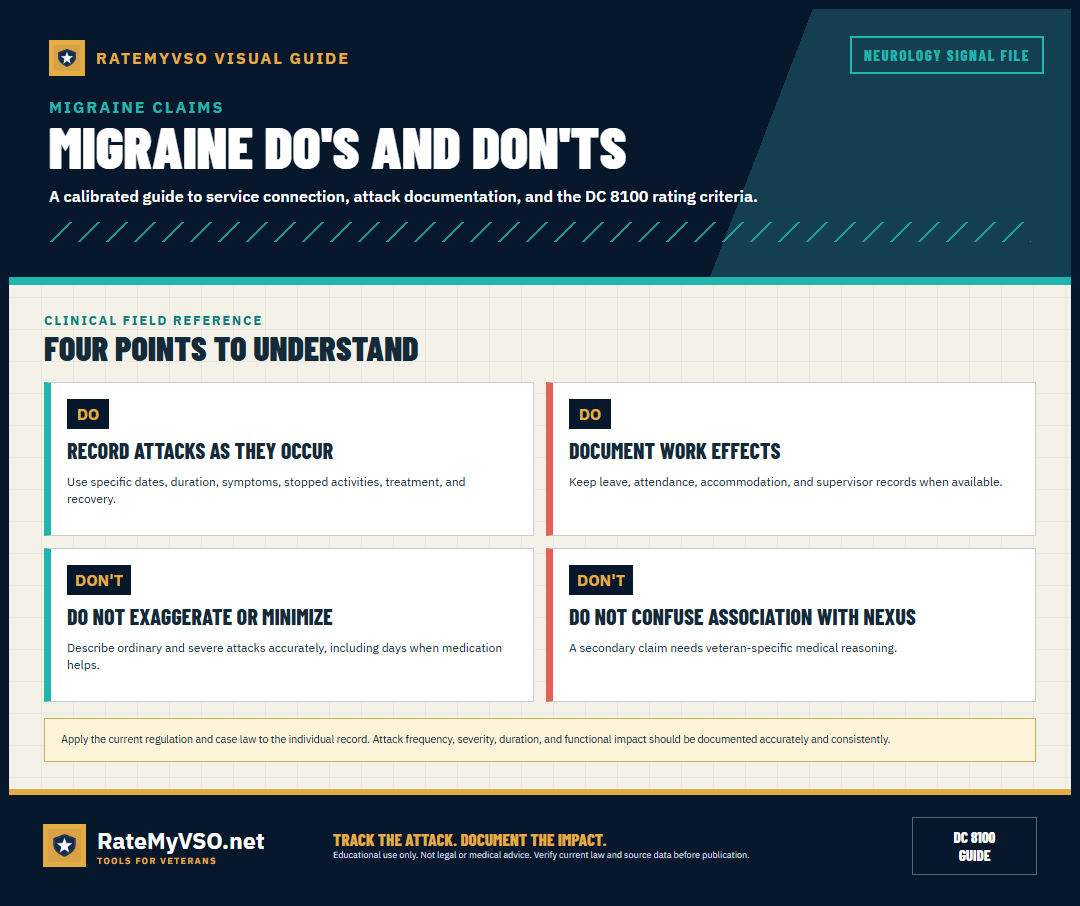
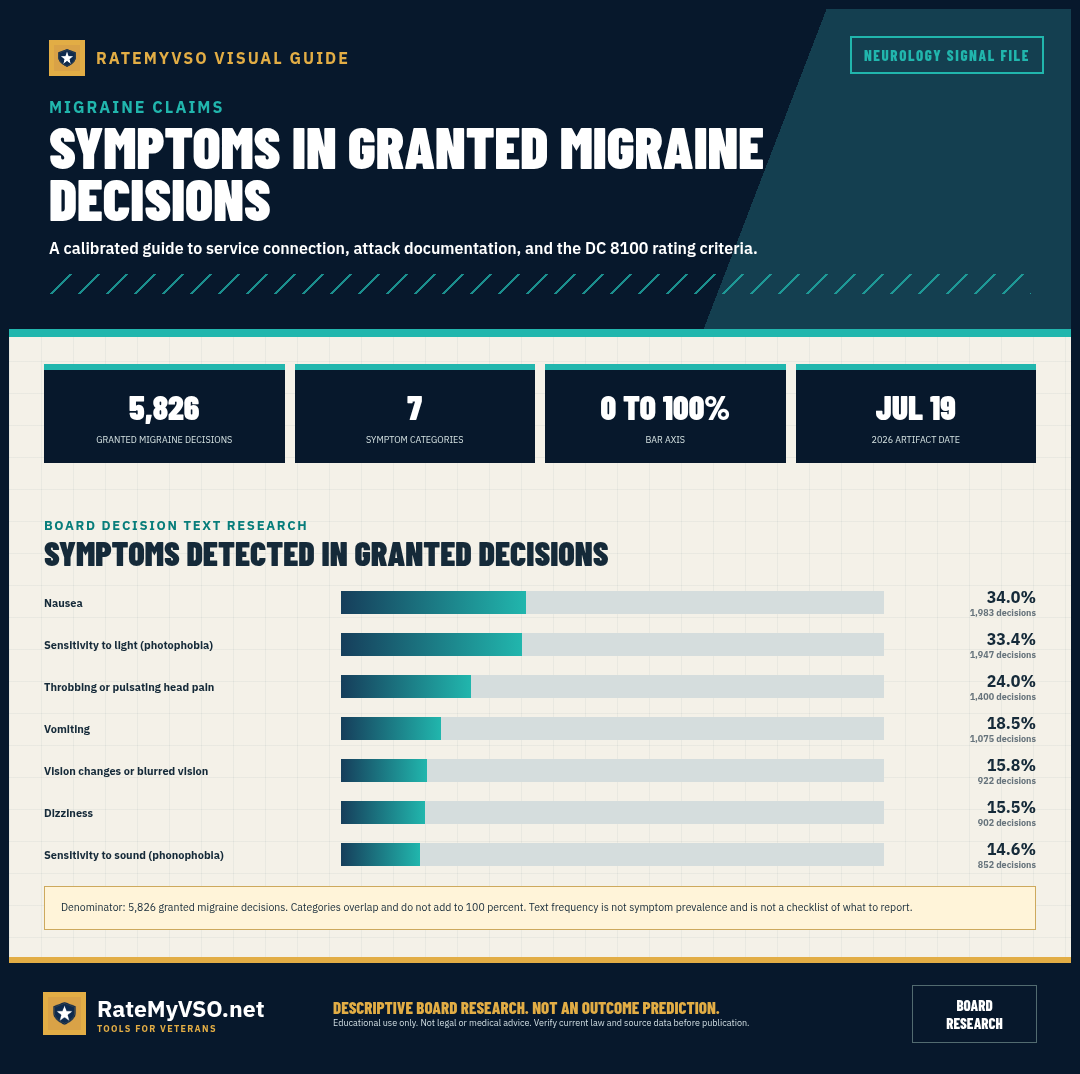
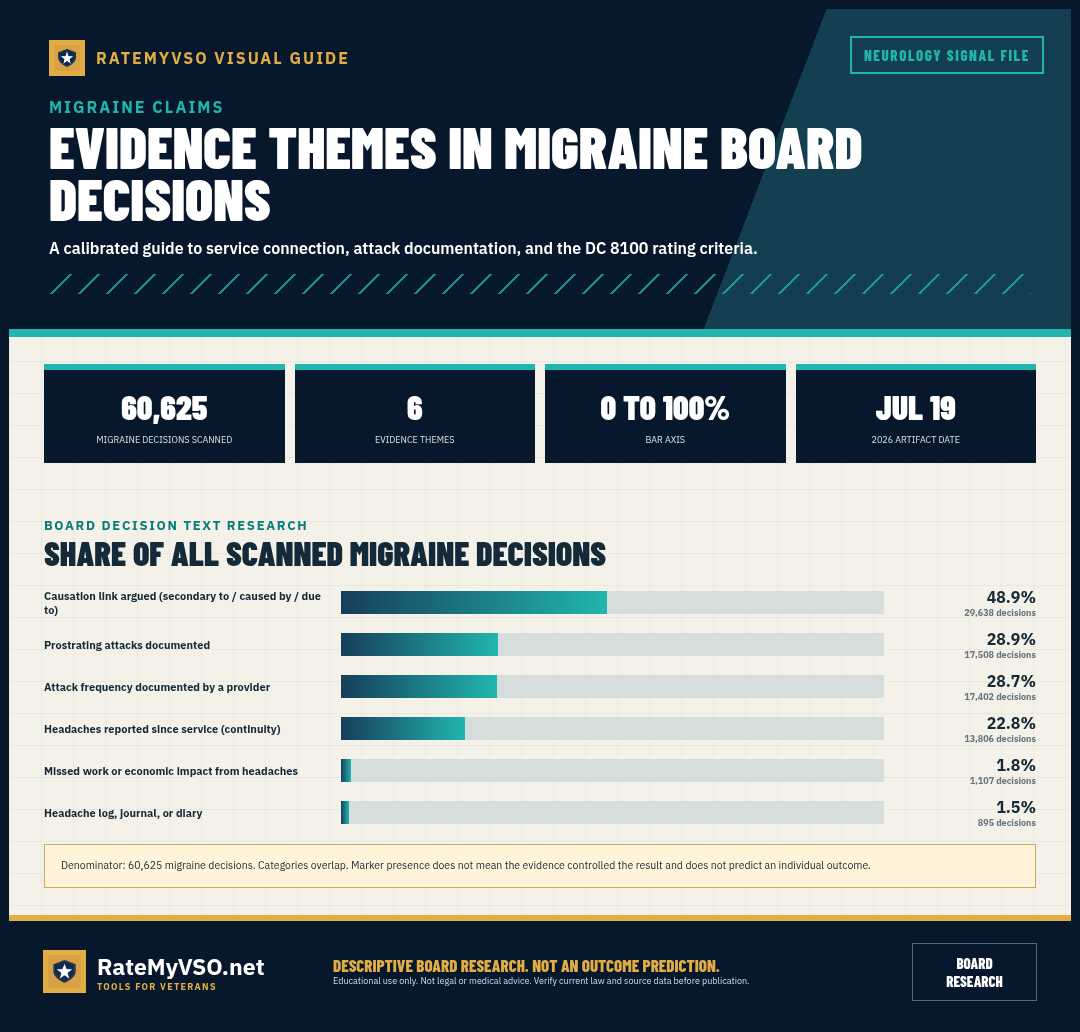
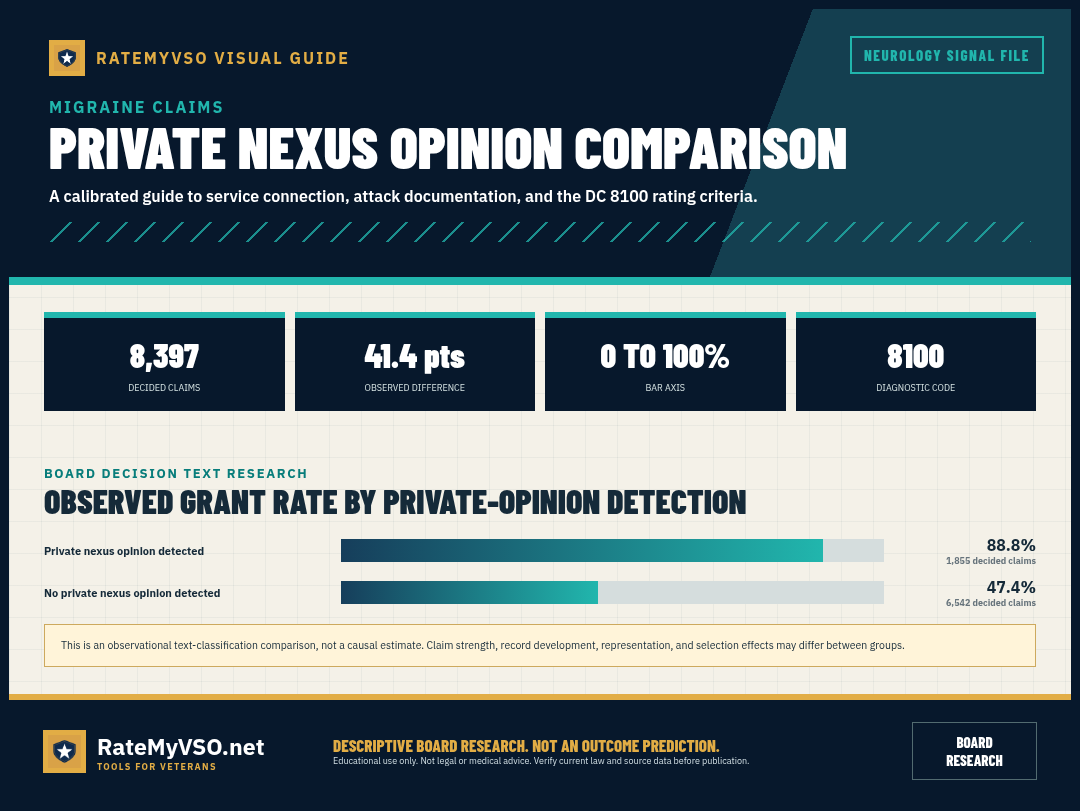
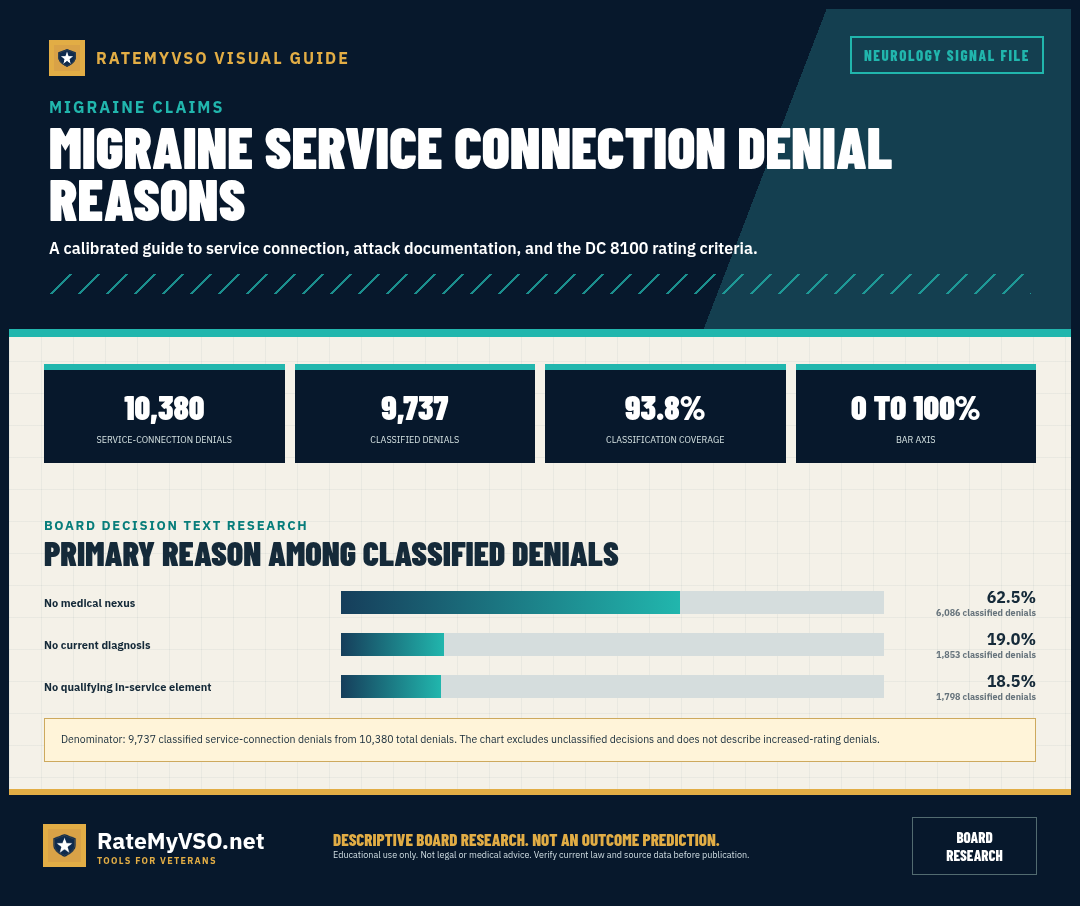
21 printable one-page charts that catalogue how VA migraine claims work: the four rating levels under Diagnostic Code 8100, what the Court has said a prostrating attack means and why there is no universal hour requirement, why severe economic inadaptability does not require total unemployability, how to keep a headache log and what other evidence matters, the direct and secondary pathways including PTSD, sleep apnea, tinnitus and TBI, what happens at the examination, and research on the symptoms, evidence, and denial reasons that appear in published Board decisions.
All 21 visual guides
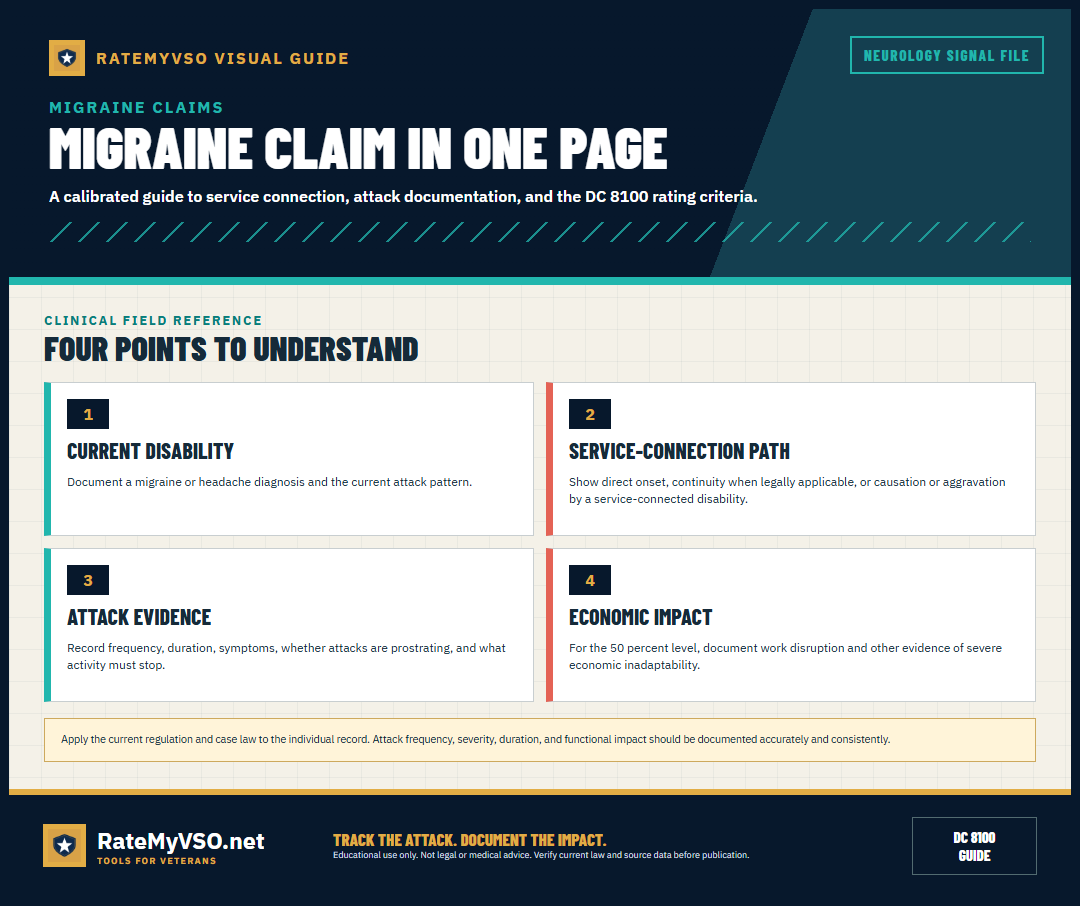
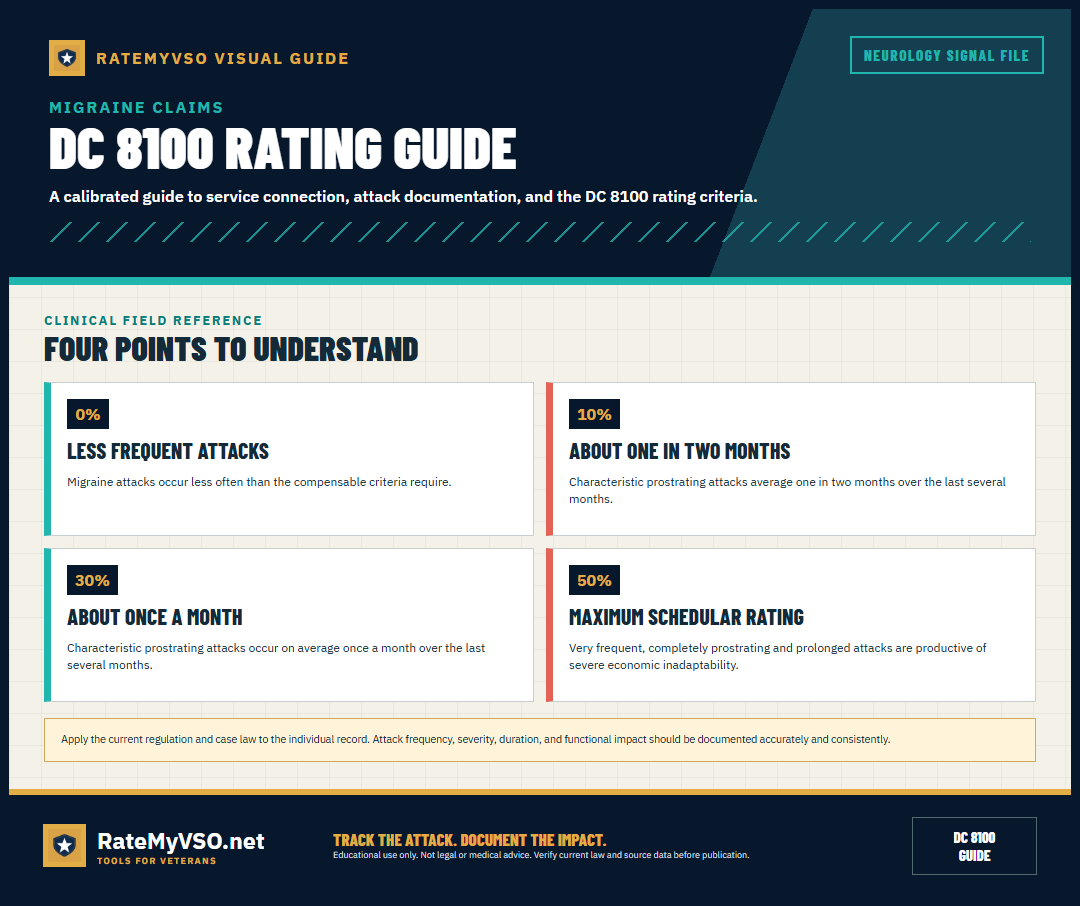
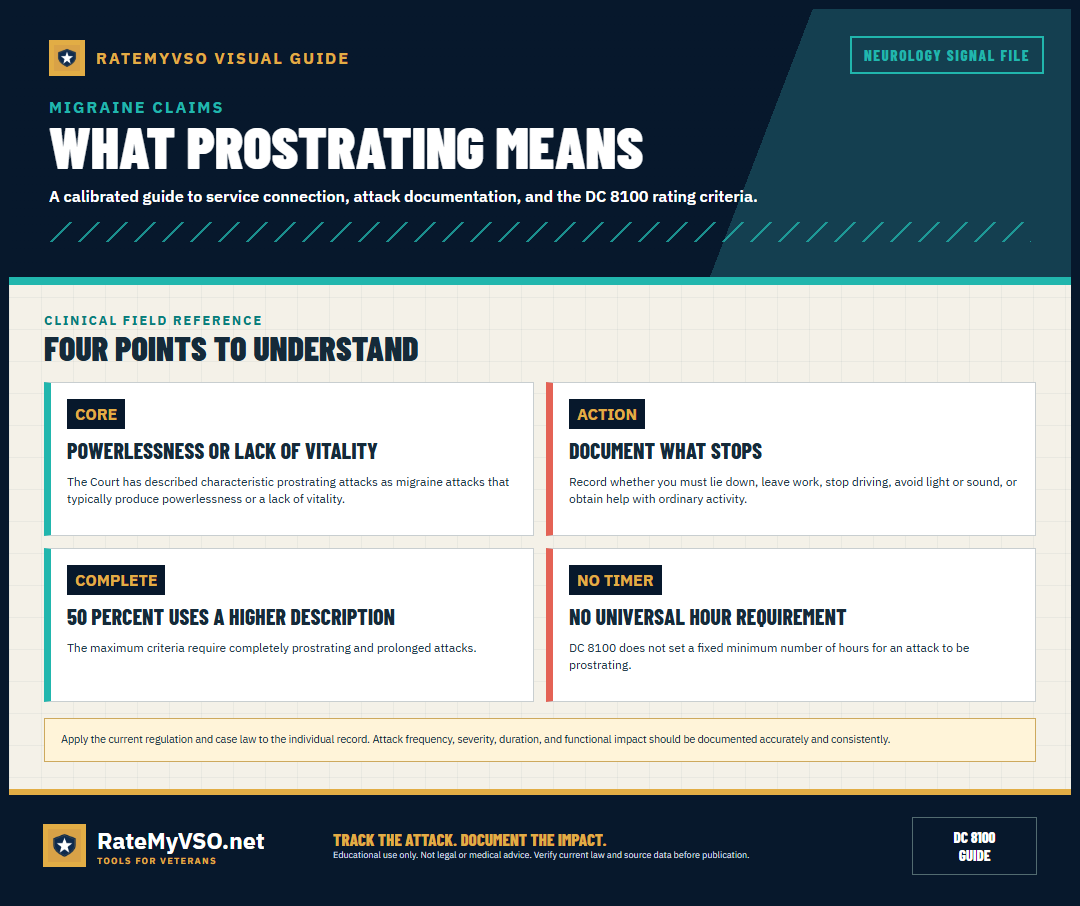
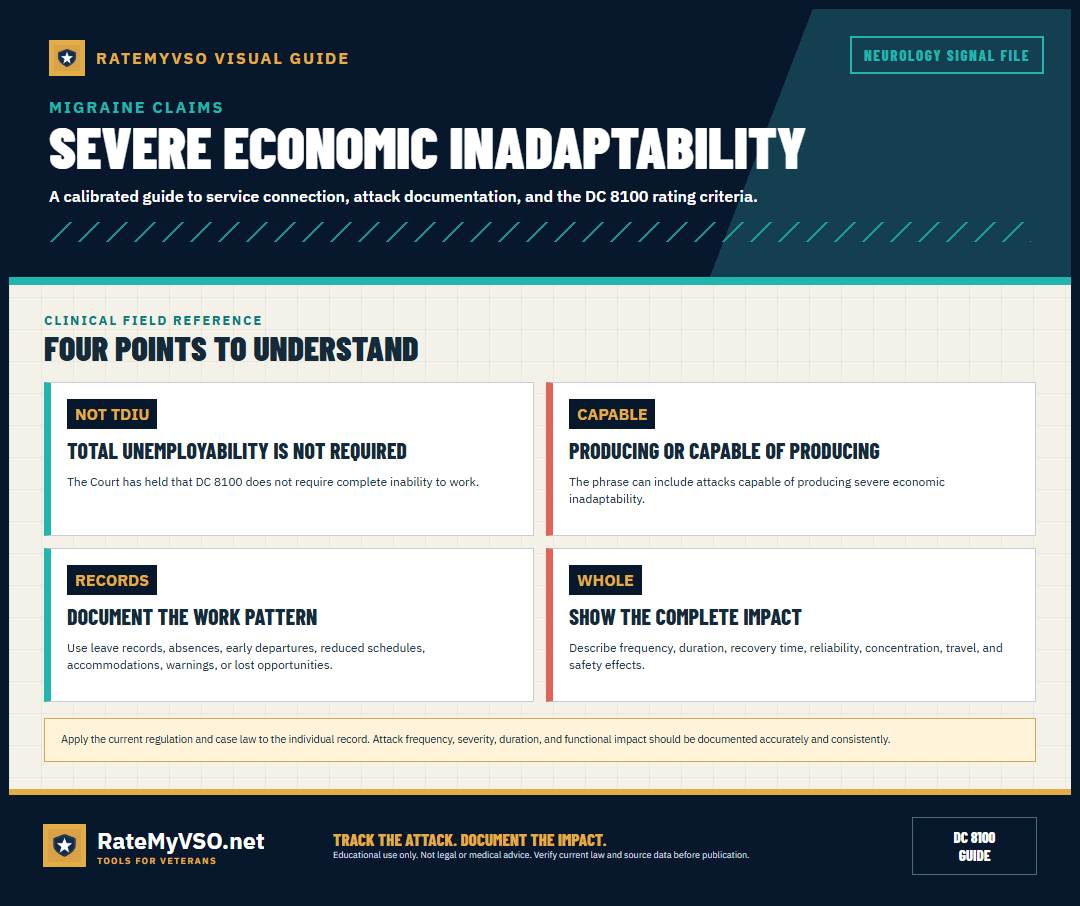
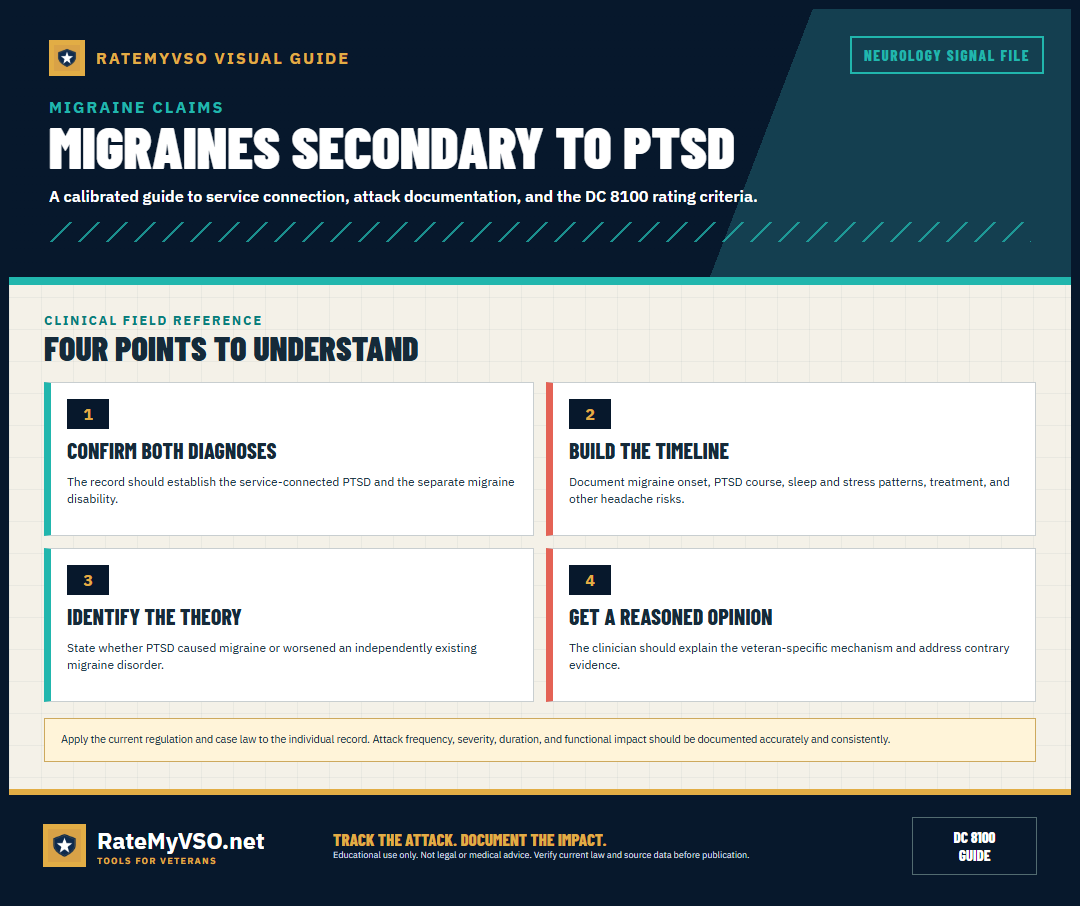
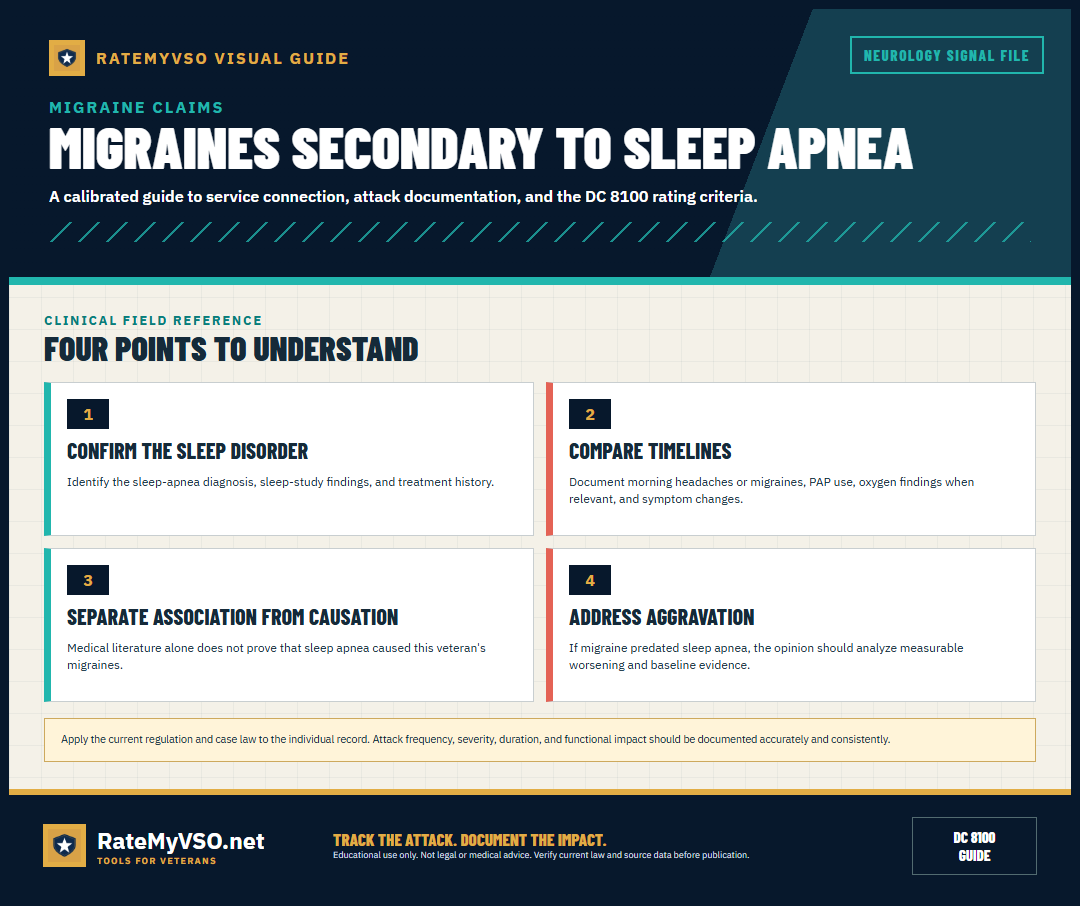
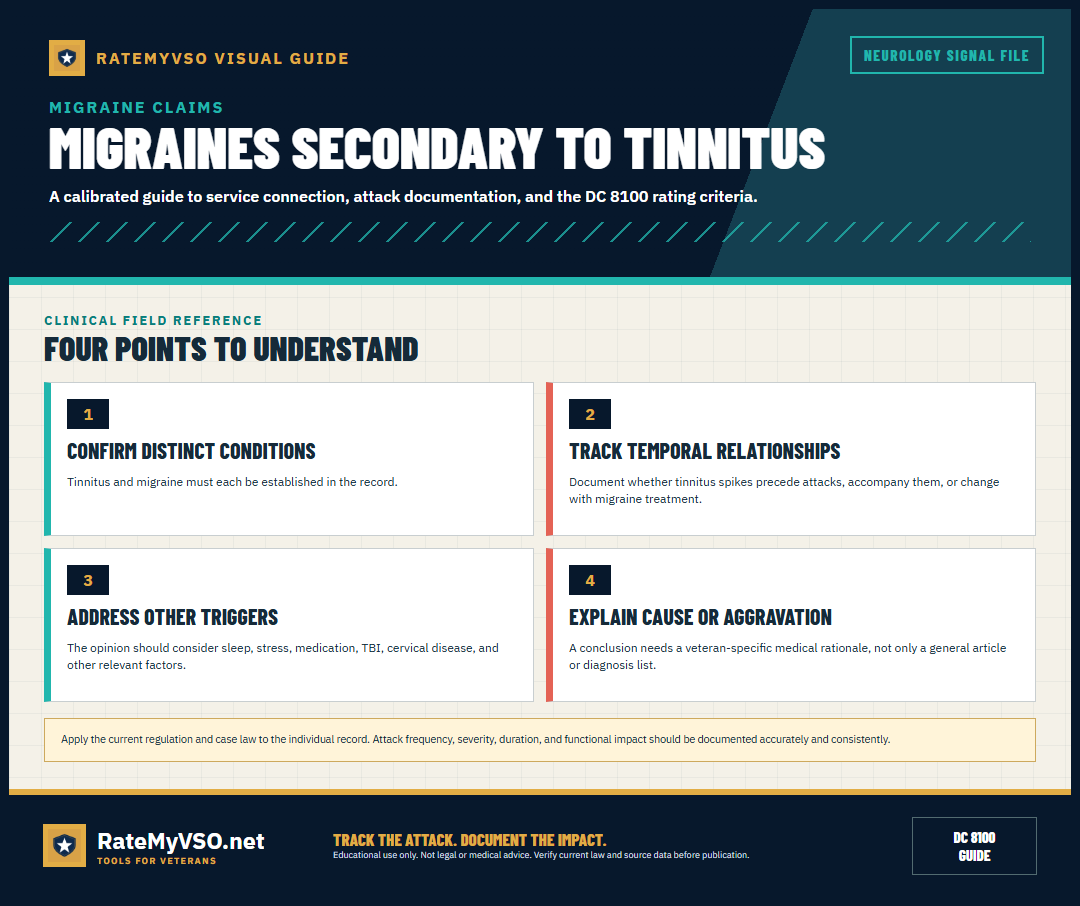
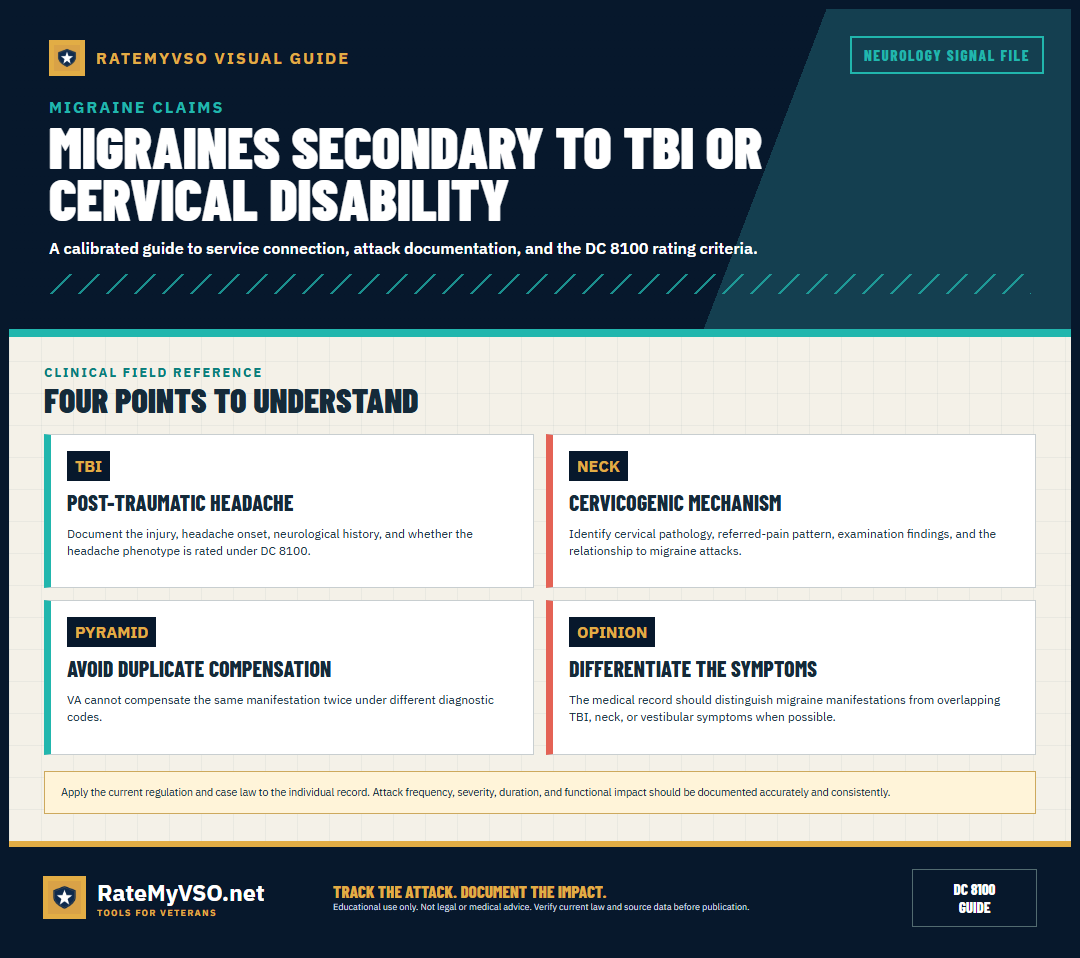
How to use this library
Every guide is a single tall image sized for printing or saving to your phone. Select any card to open the full-resolution image, or use the download link under it. The rating and evidence charts summarize the published criteria and the case law; the research charts report what RateMyVSO measured in published Board decisions, with the denominator printed on the chart itself.
These charts catalogue the published rating criteria and what appears in published Board decisions. Service connection and rating are kept separate throughout: whether a migraine is connected to service is a different question from what percentage it earns. The research charts count how often something appeared in decision text, which is not symptom prevalence, not a checklist of what to report, and not a prediction about any individual claim. The private-opinion comparison is observational and not a causal estimate. These charts are not legal or medical advice. For the full written guidance behind them, start with the migraine claims guide.